Cardano has spent years drifting lower after its 2021 peak, frustrating long-term holders and pushing many traders to write it off. But a new high-timeframe chart shared by analyst Crypto Patel indicates ADA may finally be reaching a make-or-break moment. Based on his analysis, Cardano is now sitting on a multi-year base that could decide whether the next major move is a slow grind higher or another extended period of underperformance.
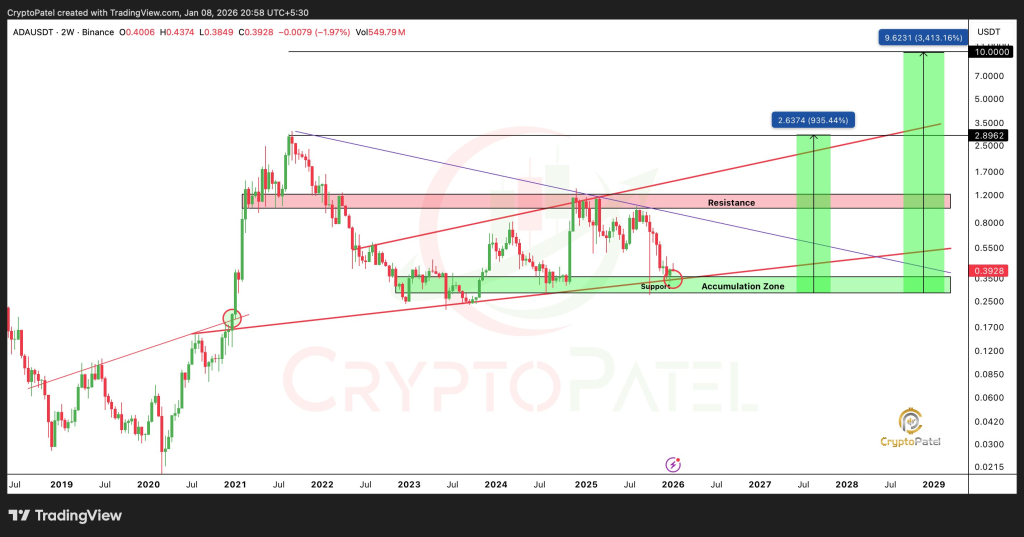
At the time of the chart, ADA is trading around $0.40 after a deep multi-year correction from its all-time high. Instead of collapsing further, the Cardano price has stabilized inside a broad accumulation zone that has held through multiple market cycles. That stability is what Patel argues matters most right now.
ADA Chart Analysis
On the 2-week timeframe, ADA is compressing inside a large symmetrical structure that has been forming since the 2021 top. Price is resting near a long-term ascending trendline while repeatedly finding demand between roughly $0.38 and $0.28. This zone has acted as support during several major sell-offs, including the 2022 bear market and later macro pullbacks.
The ADA chart also shows a descending resistance line coming down from the all-time high. That combination (rising support and falling resistance) creates the kind of pressure that often leads to a decisive breakout. According to Patel, the key area to watch is the $1.00 to $1.20 range. A sustained move above that zone would mark a structural shift, not just a short-term rally.
Source: X/@CryptoPatel
From there, Patel outlines longer-term upside targets at $2.60, $5.00, and eventually $10, assuming the broader market remains supportive and ADA holds above critical support. On the downside, he’s clear about invalidation. A weekly close below $0.28 would weaken the entire bullish thesis and indicate the base has failed.
What makes this chart interesting is not the price targets themselves, but the time spent building the base. The Cardano price has already gone through a multi-year reset, shaking out leverage and speculative excess. From a risk-reward perspective, long-term setups like this tend to attract patient capital rather than short-term traders chasing momentum.
That does not mean a move to $10 is guaranteed. The ADA price still needs confirmation through volume expansion and a clear break of long-standing resistance. It also continues to lag faster-moving narratives like meme coins and high-throughput chains. But structurally, this is the strongest long-term chart Cardano has shown since the last cycle.
**Cardano Price Outlook: A Realistic Takeaway **
The $10 figure should be viewed as a long-term scenario, not an imminent target. For now, the more important question is whether ADA can defend its current accumulation zone and eventually reclaim the $1.00–$1.20 level. If that happens, the multi-year base Crypto Patel highlights starts to look less like dead money and more like a launchpad.
Until then, Cardano remains in a patience trade. The chart indicates the downside is increasingly defined, while the upside depends on whether the broader market gives ADA the conditions it needs to finally break free.
Read also: XRP Price to $10? Bulls Just Defended the Key Zone Exactly as Planned
Disclaimer: The information on this page may come from third parties and does not represent the views or opinions of Gate. The content displayed on this page is for reference only and does not constitute any financial, investment, or legal advice. Gate does not guarantee the accuracy or completeness of the information and shall not be liable for any losses arising from the use of this information. Virtual asset investments carry high risks and are subject to significant price volatility. You may lose all of your invested principal. Please fully understand the relevant risks and make prudent decisions based on your own financial situation and risk tolerance. For details, please refer to
Disclaimer.
Related Articles
Arthur Hayes Bold Bitcoin Statement As Gold and Nasdaq-100 Slip
Since the Middle East conflict began on February 28, longtime crypto observer Arthur Hayes noted on social media that Bitcoin has quietly outperformed traditional safe havens and major tech benchmarks. Hayes pointed to a roughly 7 percent gain in Bitcoin since the strikes began, compared with a 2 pe
BlockChainReporter7m ago
PEPE Price at $0.053259 as Tight Range and Falling Volume Shape Short-Term Market Activity
PEPE was traded at $0.053259 and has recorded a 3.0 percent fall in value but it is within a thin band of support and resistance.
The market exhibited a volume of 235.15M in 24 hour trading, which is a decline of 19.16% reflecting less trading activity.
Technical indicators are not
CryptoNewsLand2h ago
Aave Price Holds Near $111 After $27M Liquidation Error Shakes DeFi
Key Insights
Aave traded near $111 after a CAPO oracle configuration error triggered $27 million in liquidations across 34 wstETH-backed accounts.
Trading activity cooled as derivatives volume dropped and open interest declined, signaling that traders stepped back following the liquidation in
CryptoFrontNews3h ago
XRP Holds $1.34 Support While Leverage Heatmap Highlights $1.30 Risk Zone
XRP is trading at $1.36 in a tight range of support at $1.34 and resistance at $1.37.
The heatmap data indicates that there is a huge amount of long positions in the range of $1.30.
Should prices fall to around $1.30, long positions with high leverage in this region might
CryptoNewsLand3h ago
Crypto Market Update – River and Hyperliquid Lead Gainers As Decentralized Infrastructure Gains M...
The crypto market is displaying its typical volatility once again, yet under the noise of price movements, the beginnings of a narrative are starting to take shape. As of today, the “Top Gainers” on CoinMarketCap leans heavily towards projects targeting decentralized infrastructure and fast Layer-1s
BlockChainReporter4h ago
Solana Approaches Key Sell Wall at $84.78 — Will Momentum Hold for a Move Toward $89?
Solana is trading at an approximate price of $83.18, although a solid sell wall is at an approximate price of $84.78, which prevents upward movement.
The price is trapped between the support at $81.99 and the resistance at $84.78 which is short term consolidation.
Once buyers hit the
CryptoNewsLand4h ago