
Date: Fri, Jan 02, 2026 | 09:15 AM GMT
The broader cryptocurrency market has started the new year on a stable footing, with both Bitcoin (BTC) and Ethereum (ETH) trading slightly higher and posting gains of over 1.5%. This modest strength across major assets has provided breathing room for risk-on sentiment, allowing several memecoins to show early signs of recovery — including Popcat (SOL) (POPCAT).
POPCAT is currently trading by solid 19% higher on the day, but the more important development lies in its broader technical structure. After months of consistent downside pressure, the price action is now beginning to hint at a potential trend reversal, supported by a well-defined bullish pattern forming on the daily chart.

Source: Coinmarketcap
Falling Wedge Pattern in Play
On the daily timeframe, POPCAT appears to be carving out a falling wedge formation — a classic bullish reversal pattern that often develops after extended downtrends. This structure is characterized by lower highs and lower lows that gradually converge, reflecting weakening selling pressure and growing buyer interest near the lows.
Following weeks of steady decline, POPCAT recently established a local bottom near the $0.0725 region. This area acted as a strong demand zone, where buyers stepped in aggressively and prevented further downside. The resulting rebound pushed price back toward the $0.088 level, placing POPCAT just beneath the wedge’s upper resistance trendline.
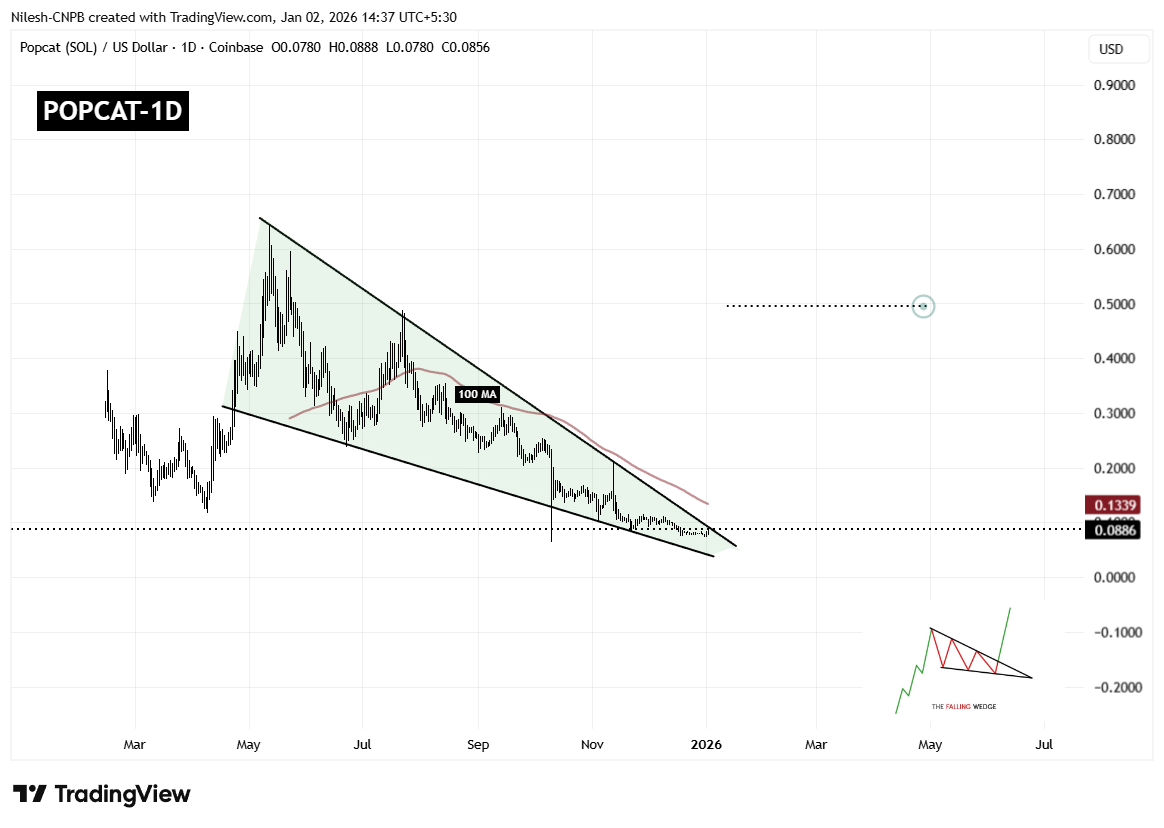
Popcat (POPCAT) Daily Chart/Coinsprobe (Source: Tradingview)
This compression near resistance is technically significant, as falling wedges tend to resolve with a sharp upside move once price breaks out of the structure. The longer price coils within the wedge, the stronger the eventual breakout tends to be.
However, overhead resistance remains notable. The 100-day moving average, currently hovering around $0.1339, represents a major technical barrier. This level has previously acted as dynamic resistance and will likely be a key area to watch if a breakout occurs.
What’s Next for POPCAT?
If buyers manage to push price decisively above the wedge resistance and reclaim the 100-day moving average with a strong daily close, POPCAT could confirm a bullish breakout. Such a move would mark a clear shift in trend structure and could open the door for a larger recovery rally.
Based on the measured move of the falling wedge pattern, the upside projection points toward the $0.49 region. Reaching this level would represent a substantial recovery from current prices and could attract renewed interest from momentum traders and sidelined participants.
That said, failure to break above resistance could result in continued consolidation. In a bearish scenario, POPCAT may revisit the $0.072 support zone once again. As long as this level continues to hold, the broader falling wedge structure would remain intact, keeping the bullish reversal thesis alive.
Overall, POPCAT is approaching a technically critical juncture. With price tightly compressed, selling pressure fading, and buyers defending key support levels, the coming sessions could prove decisive in determining whether this memecoin is ready to stage its next meaningful move higher.
Disclaimer: The views and analysis presented in this article are for informational purposes only and reflect the author’s perspective, not financial advice. Technical patterns and indicators discussed are subject to market volatility and may or may not yield the anticipated results. Investors are advised to exercise caution, conduct independent research, and make decisions aligned with their individual risk tolerance.
About Author: Nilesh Hembade is the Founder and Lead Author of Coinsprobe, with over 5 years of experience in the cryptocurrency and blockchain industry. Since launching Coinsprobe in 2023, he has been providing daily, research-driven insights through in-depth market analysis, on-chain data, and technical research.
Disclaimer: The information on this page may come from third parties and does not represent the views or opinions of Gate. The content displayed on this page is for reference only and does not constitute any financial, investment, or legal advice. Gate does not guarantee the accuracy or completeness of the information and shall not be liable for any losses arising from the use of this information. Virtual asset investments carry high risks and are subject to significant price volatility. You may lose all of your invested principal. Please fully understand the relevant risks and make prudent decisions based on your own financial situation and risk tolerance. For details, please refer to
Disclaimer.
Related Articles
Crude oil and gold volatility indices hit new highs in 2021, with bullish sentiment dominating the crypto options market.
On March 12th, Gate Research Institute noted that the volatility of traditional assets such as gold and crude oil reached new highs, at 33% and 108% respectively. In the crypto assets sector, the implied volatility of BTC and ETH is also high. Recently, the market has been dominated by put options, but the demand for hedging has weakened, and short-term price fluctuations may be influenced by Gamma effects. Gate has also launched gold and crude oil options, marking the first introduction of traditional assets.
GateNews1m ago
21Shares Analyst: BTC May Fluctuate Between $68,000 and $74,000 in the Short Term
21Shares strategist Matt Mena pointed out that March CPI data has been absorbed by the market. In the short term, BTC is expected to fluctuate between $68,000 and $74,000. After breaking above $75,000, it may enter the $75,000 to $80,000 range. Historically, BTC often rebounds more than 15% after geopolitical shocks, and a restart of rate cuts could accelerate the recovery.
GateNews43m ago
10x Research: Model triggered the most altcoin buy signals since October last year
Gate News Report, March 12 — Market analysis firm 10x Research stated on the X platform that its model has triggered the most altcoin buy signals since October of last year. Although the overall sentiment in the crypto market remains weak and trading volume is near lows, the technical momentum of some altcoins is improving and aligns with fundamental catalysts.
GateNews59m ago
Analyst: Bitcoin's current support level is $62,791, and resistance level is $71,840.
Gate News Report, March 12, According to analyst @alicharts, Bitcoin's current support level is at $62,791, and resistance is at $71,840. The analyst stated that only a clear breakout in either direction can determine the next trend.
GateNews1h ago
Why did Bitcoin rise today? CPI met expectations, and the Federal Reserve confirmed no change in policy
The US February Consumer Price Index met expectations, prompting Bitcoin prices to rebound to around $70,000. The CPI report reduced market uncertainty regarding the Federal Reserve's interest rate decisions, which is favorable for risk assets. Despite global market pressures, Bitcoin continues to benefit from short-term sentiment improvement, but rising energy prices could reignite inflation and impact liquidity. $72,000 is an important resistance level for Bitcoin; a breakthrough is needed for further upward movement.
MarketWhisper1h ago
Today, the cryptocurrency Fear and Greed Index rose to 18, and the market remains in extreme fear.
Gate News Report, March 12 — According to data from Alternative.me, the cryptocurrency Fear & Greed Index rose to 18 today, up from 15 yesterday, but market sentiment remains in a state of "Extreme Fear."
GateNews2h ago