
Worldcoin price has spent months moving quietly while the rest of the crypto market chased faster stories. That calm may be changing. A close look at the WLD chart shows a structure that has been building patiently, and the recent price action suggests the market could be setting up for something bigger.
The latest 12 hour chart highlights a technical shift that began earlier in 2026. The move has caught the attention of analyst Jonathan Carter, known on X as @JohncyCrypto, who has been closely tracking how WLD price behaves after breaking out of a long downtrend.
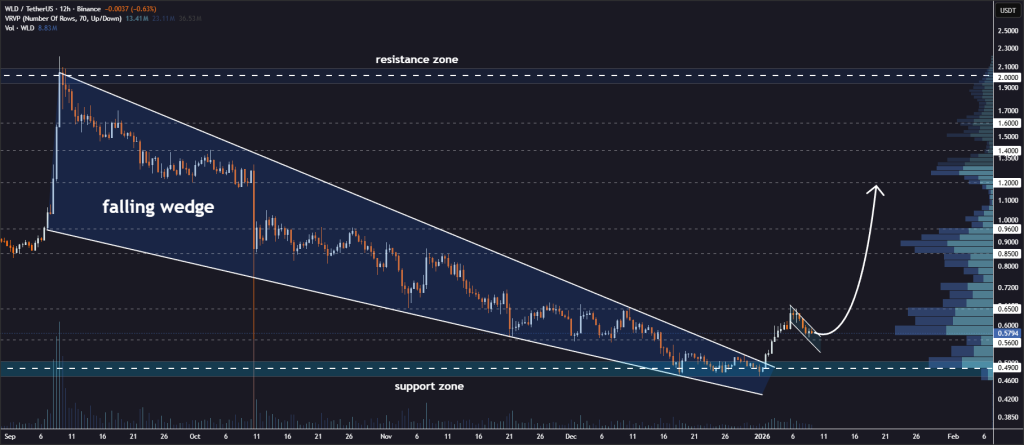
Worldcoin spent much of late 2025 trading inside a clear falling wedge. Lower highs and lower lows kept compressing price until momentum finally shifted. The first few days of 2026 marked a decisive moment when WLD price pushed above the upper boundary of that descending wedge.
That breakout mattered because falling wedges often signal trend exhaustion. Once the price cleared the wedge resistance, Worldcoin price spiked higher and briefly moved with strong upward momentum. Jonathan Carter highlighted this move as the first signal that the broader downtrend had weakened.
Price did not continue straight up. That pause has become the most interesting part of the story.
- WLD Price Is Now Pulling Back In A Bullish Flag Structure
- Key Resistance Levels Could Shape The Next Worldcoin Price Move
- What To Watch Next As Worldcoin Price Develops
WLD Price Is Now Pulling Back In A Bullish Flag Structure
After the initial breakout rally, Worldcoin price started to cool off. The decline did not erase the breakout. Instead, price began drifting lower in a tight and controlled channel. This type of movement is commonly seen after strong impulses and often reflects consolidation rather than weakness.
@JohncyCrypto / X
Jonathan Carter describes this phase as a bull flag forming above the broken falling wedge. The structure shows WLD price retracing gradually while holding above the former resistance zone, which now acts as support. That behavior keeps the bullish structure intact and suggests the market is digesting earlier gains.
The attached chart makes this clearer. The flag sits neatly above the prior wedge breakout, and volume remains relatively steady. That combination keeps the setup constructive rather than threatening.
Key Resistance Levels Could Shape The Next Worldcoin Price Move
Worldcoin price now faces an important test. The upper boundary of the bull flag and nearby resistance levels will likely decide the next direction. Jonathan Carter outlined several zones to watch if momentum returns.
A clean breakout above the flag could open the door toward $0.65 first. Sustained strength beyond that level may place $0.85 and $0.96 back on the chart. A stronger continuation move could even bring $1.20 into focus if broader market conditions remain supportive.
Price rejection near current resistance would delay that scenario. Even then, the structure would remain valid as long as WLD price holds above the former wedge support.
What To Watch Next As Worldcoin Price Develops
What’s next for WLD price? A breakout from the bull flag would confirm that the pullback phase has ended and that the larger move is resuming. Market sentiment also plays a role. A positive environment across major cryptocurrencies like Bitcoin and Ethereum could help WLD price push higher and print a higher high.
Hedera (HBAR) Price to $5 Sounds Unreal Until You Do the Math_**
Jonathan Carter continues to emphasize patience. The setup already exists. The trigger still needs to arrive. Watching how price behaves near resistance zones will offer the clearest clues about what comes next.
Worldcoin price has moved from quiet compression to visible structure. That shift alone makes WLD worth watching as the market moves deeper into 2026. The chart tells a story that is still unfolding, and the next chapter may not stay quiet for long.
Disclaimer: The information on this page may come from third parties and does not represent the views or opinions of Gate. The content displayed on this page is for reference only and does not constitute any financial, investment, or legal advice. Gate does not guarantee the accuracy or completeness of the information and shall not be liable for any losses arising from the use of this information. Virtual asset investments carry high risks and are subject to significant price volatility. You may lose all of your invested principal. Please fully understand the relevant risks and make prudent decisions based on your own financial situation and risk tolerance. For details, please refer to
Disclaimer.
Related Articles
Ethereum Continues to Recover, Analysts Discuss Whether It Can Return to $4000 in Q2
Gate News reported that on March 19, Ethereum (ETH) continues to recover following recent market volatility. Analysts are discussing whether Ethereum can climb back to the $4,000 mark in Q2 2026.
GateNews9m ago
Bitcoin Rejects $76K as War and PPI Rock Markets
_ Bitcoin rejected $76,000 resistance as US strikes on Iran, hot PPI at 3.4%, and Powell’s FOMC tone sent crypto and risk assets into a sell-off._
Bitcoin hit $76,000 and turned back around. The rejection was clean. Sellers were waiting right at the level that traders had marked for
LiveBTCNews45m ago
ZANO 4.6% gains 11.2% to $7.25, technical chart shows bullish rectangle pattern
Gate News reports that on March 19, ZANO token price surged rapidly to $7.25, up 11.2%, with trading volume rising in sync. Technical analysis shows ZANO exhibits a bullish rectangle pattern, with price entering a consolidation phase after the rapid surge, and market signs of buyer entry appearing.
GateNews1h ago
This Friday Traditional Financial Markets Welcome 'Quadruple Witching Day,' Bitcoin Volatility May Rise Accordingly
This Friday will see the quarterly derivatives event "Quadruple Witching Day," which may lead to increased market volatility. The current market environment is highly volatile, with the VIX index breaking through 35, and Bitcoin volatility is also likely to rise. Additionally, on March 27th, there is a large-scale derivatives expiration, which will intensify market volatility risks.
GateNews1h ago
XRP trading price is $1.43, and the RSI indicator shows oscillation in the neutral zone.
Gate News reported that on March 19, XRP is currently trading at $1.43, with a Relative Strength Index (RSI) of 49.65, sitting in the neutral zone. Technical analysis shows XRP price oscillating between the $1.40 support level and the $1.50 resistance level.
GateNews2h ago
ZANO Roars Back, Records 11.2% As Bullish Rectangle Structure Prints Continuing Market Rally: Ana...
Zano (ZANO) coin is experiencing a surge in price and trading volume, reaching $7.25. Analysts note a bullish rectangle pattern indicating sustained upward momentum, reflecting increased demand for privacy-focused cryptocurrencies amid broader market recovery.
BlockChainReporter3h ago
