
**Date: **Fri, Jan 02, 2026 | 03:10 PM GMT
The broader cryptocurrency market has started the new year with modest strength, as both Bitcoin (BTC) and Ethereum (ETH) trade firmly in the green with gains of over 2%. While this positive momentum is lifting most altcoins, the privacy-focused token Zcash (ZEC) is moving against the broader trend.
ZEC is down more than 8% on the day. However, despite the red candles, the daily chart suggests this pullback may be a healthy bullish retest rather than the start of a trend reversal.
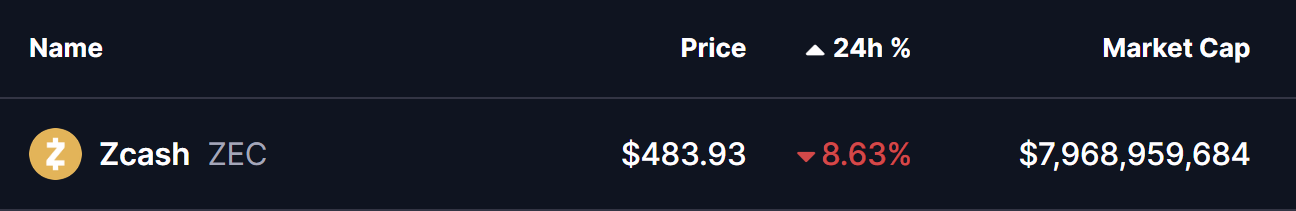
Source: Coinmarketcap
Retesting the Ascending Triangle Breakout
On the daily timeframe, ZEC had been consolidating inside a well-defined ascending triangle pattern, characterized by a series of higher lows pressing against a flat resistance zone near $476. This structure signaled steady accumulation and growing buyer confidence.
Earlier, bulls successfully broke above the $476 ceiling with strong momentum, sending ZEC sharply higher by nearly 66% — from the breakout base to a local peak around $556.59. This move confirmed the validity of the pattern and marked a clear shift in market structure.
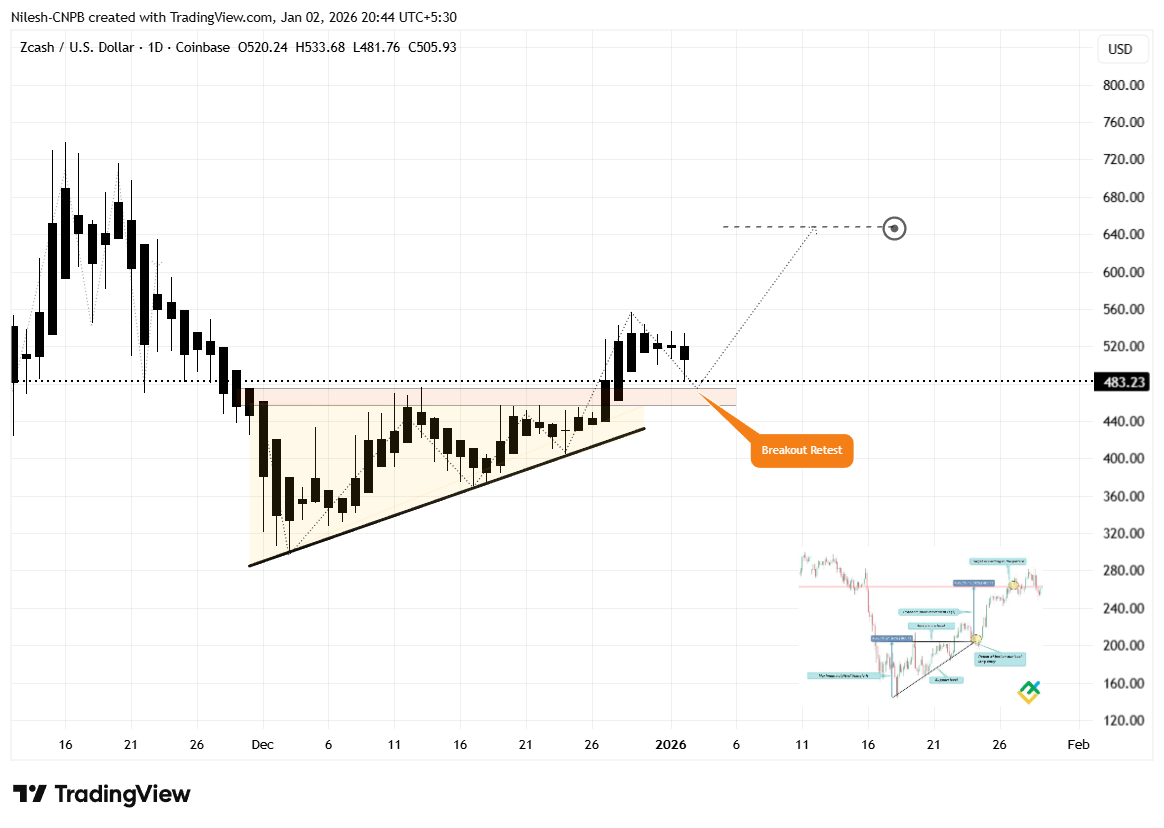
Zcash (ZEC) Daily Chart/Coinsprobe (Source: Tradingview)
Following that rally, price has pulled back and is now trading near the $483 region. Crucially, this zone aligns closely with the former breakout level, making it a classic resistance-turned-support area. Such retests are common after strong breakouts and often act as a launchpad for the next leg higher if buyers defend the level.
What’s Next for ZEC?
The current retest phase is technically constructive, but the next move will depend on whether bulls can firmly defend the broader $426–$476 support zone. A strong reaction from this area would signal that buyers remain in control and are using the dip to accumulate.
If support holds and momentum returns, ZEC’s first key objective will be a reclaim of the $556.59 local high. A decisive move above this level would confirm strength and open the door for further upside.
In that scenario, ZEC could advance toward the ascending triangle’s measured target near $647.73, representing a potential upside of roughly 32% from current levels.
On the downside, failure to hold above the $426 support zone would weaken the bullish breakout structure and raise the risk of a deeper pullback, potentially turning the recent move into a failed breakout.
For now, all eyes remain on the breakout retest. How ZEC reacts around this key support area will likely determine whether the recent rally was just the beginning — or a move that needs more time to rebuild momentum.
Disclaimer: The views and analysis presented in this article are for informational purposes only and reflect the author’s perspective, not financial advice. Technical patterns and indicators discussed are subject to market volatility and may or may not yield the anticipated results. Investors are advised to exercise caution, conduct independent research, and make decisions aligned with their individual risk tolerance.
About Author: Nilesh Hembade is the Founder and Lead Author of Coinsprobe, with over 5 years of experience in the cryptocurrency and blockchain industry. Since launching Coinsprobe in 2023, he has been providing daily, research-driven insights through in-depth market analysis, on-chain data, and technical research.
Disclaimer: The information on this page may come from third parties and does not represent the views or opinions of Gate. The content displayed on this page is for reference only and does not constitute any financial, investment, or legal advice. Gate does not guarantee the accuracy or completeness of the information and shall not be liable for any losses arising from the use of this information. Virtual asset investments carry high risks and are subject to significant price volatility. You may lose all of your invested principal. Please fully understand the relevant risks and make prudent decisions based on your own financial situation and risk tolerance. For details, please refer to
Disclaimer.
Related Articles
CFX 4-hour chart reaches a new high for the phase, with approximately 14% increase over 24 hours
Gate News: On March 15, market data shows that CFX reached a new phase high on the 4-hour K-line chart, with prices touching approximately 0.06282 USDT at their peak, representing a 24-hour gain of around 14%. Some community members believe this rally may be related to recent macroeconomic catalysts. Earlier, media outlets citing sources reported that Iran is considering allowing certain tankers to pass through the Strait of Hormuz on the condition that petroleum transport be settled in Chinese yuan. Related discussions have once again sparked market attention toward yuan stablecoins and cross-border payment narratives.
GateNews23m ago
After the network upgrade: What prospects await SOL?
The official approval of protocol SIMD-0266 aims to optimize computing efficiency on the Solana network by introducing p-tokens, simplifying transaction processing. This upgrade, set for April, has prompted increased buying activity and could lead to significant cost reductions and performance improvements.
TapChiBitcoin1h ago
Track FET's journey to the $0.24 milestone as the AI cryptocurrency sector records its most positive trading week in months
The cryptocurrency industry related to AI has recently recorded an impressive performance. According to data from CoinMarketCap, the total market capitalization of this sector has grown 16% in just the past week. Many leading tokens in this category have also achieved significant growth, attracting
TapChiBitcoin1h ago
DeFi enters a "winter of yields": liquidity stagnation, leverage contraction, and the disappearance of arbitrage opportunities
Since September 2025, the DeFi market has entered a "interest rate winter," with the annualized deposit yields of mainstream stablecoins dropping to lows, and supply and demand imbalances causing excess liquidity. As borrowing demand declines, stablecoin lending rates have also decreased, and the reduced risk appetite in the crypto market has led investors to shift toward more stable assets. Some protocols, such as Sky, offer stable returns through real-world assets, but the overall trend still indicates a period of adjustment and structural reform in DeFi.
区块客1h ago
Crypto Analyst and Expert Says Bull Market Is Confirmed as Bitcoin Survives Shakeout
Crypto analyst and expert says bull market is confirmed.
Bitcoin survives a shakeout nd mirrors 2022 price chart.
This shows a positive sign for BTC to set a new ATH price soon.
The crypto market seems to be heading into a strong recovery phase as the price of Bitcoin (BTC) recovers pr
CryptoNewsLand2h ago
Crypto Market Shows Gradual Growth As Top Assets Turn Green
The global crypto market saw a slight increase in total capitalization, while trading volume dropped significantly. Bitcoin and Ethereum prices rose modestly, with notable gains from altcoins like $DOGS, $PI, and $PEPE. DeFi TVL rose slightly, but NFT sales volume fell sharply. Key developments included new investments in gold-related tokens and Aave's launch of Aave Shield to reduce transfer slippage.
BlockChainReporter2h ago