
The JASMY chart is finally starting to behave differently, and that’s what makes this setup interesting. For a long time, every rally ran into sellers and faded back lower.
The trend leaned down, momentum stayed weak, and buyers never really got control. This latest move stands out because that pattern appears to be changing.
What Javon Marks calls the “major break” lines up well with what the chart is showing. Jasmy has spent months compressing inside descending wedge structures.
Each time, the JASMY price drifted lower in a controlled way, volatility dried up, and then a sharp move followed. The difference this time is that the breakout actually stuck. Instead of rolling back over, price pushed through wedge resistance and held above it.
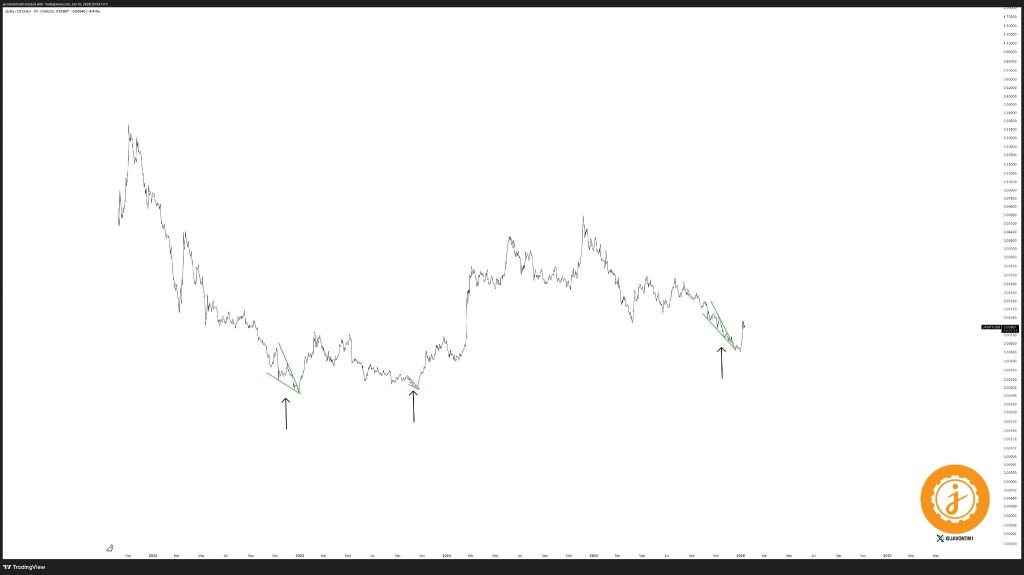
Source: X/@JavonTM1
- What the JASMY chart is telling us now
- Key levels that matter from here
- JASMY price prediction and the bigger picture
What the JASMY chart is telling us now
The most important shift is behavioral. JAMSY is no longer reacting like an asset that gets sold into every bounce. Buyers are starting to step in earlier and defend pullbacks.
After breaking out of the wedge, the price didn’t immediately give everything back. Instead, it began forming a base above the former resistance area, which is a subtle but meaningful change.
In the short term, the goal for the JASMY price is simple. It needs to stay above that breakout zone. As long as price doesn’t slide back into the old wedge, the structure remains constructive. That’s what separates a real trend change from a temporary relief bounce.
Silver Price Prediction for 2026–2030: Where Silver Could Be Headed Next_**
Key levels that matter from here
On the upside, the next area to watch is the prior reaction zone overhead, where Jasmy previously struggled before the last leg lower. If price can work through that region and hold, it opens the door to a broader upside move toward the next range highs visible on the chart.
On the downside, the risk is also clear. If the JASMY price falls back below the breakout area and re-enters the wedge, the market would likely treat this move as a failed breakout. That scenario usually leads to price drifting back toward recent lows as confidence fades.
JASMY price prediction and the bigger picture
Right now, the most realistic JASMY price prediction depends on confirmation, not hype. If price continues to hold the breakout zone and prints higher lows, continuation becomes the more likely path.
That’s when overhead resistance levels start to matter again, and momentum traders pay closer attention. If that confirmation doesn’t show up, patience is still required. The chart has improved, but it hasn’t fully proven itself yet.
Jasmy isn’t about chasing a single green candle. It’s about watching whether structure continues to improve, because that’s what ultimately decides where the next meaningful move heads.
Disclaimer: The information on this page may come from third parties and does not represent the views or opinions of Gate. The content displayed on this page is for reference only and does not constitute any financial, investment, or legal advice. Gate does not guarantee the accuracy or completeness of the information and shall not be liable for any losses arising from the use of this information. Virtual asset investments carry high risks and are subject to significant price volatility. You may lose all of your invested principal. Please fully understand the relevant risks and make prudent decisions based on your own financial situation and risk tolerance. For details, please refer to
Disclaimer.
Related Articles
Bitcoin Cash Battles $459 Resistance as Massive Sell Walls Stack Toward $650
BCH is trading at $455.86 close to the resistance range of $459.20 with the support level of $447.44.
The chart data indicates that the chart has strong resistance levels at around $520, $580 and $650 which restricts the momentum on short term upside.
Following a sharp fall, price
CryptoNewsLand18m ago
HYPE Hits $35.53 After 2.4% Jump — Will Momentum Hold as Price Tests $35.59 Resistance?
Hyperliquid’s HYPE trades at $35.53, approaching the $35.59 resistance after a 2.4% daily gain.
The chart shows the $33.67 zone acting as support after price moved above a previously contested level.
Price now trades between $33.67 support and $35.59 resistance, shaping the immediate
CryptoNewsLand1h ago
Is Injective (INJ) a Dead Coin or the Next 2800% Opportunity? Here’s What The Chart Is Saying
The Injective price has fallen sharply from its previous all-time high, leading some traders to question whether the project has lost its momentum.
However, a recent technical analysis shared by top analyst Crypto Patel suggests that the recent decline may actually represent a typical
CaptainAltcoin2h ago
CFX 4-hour chart reaches a new high for the phase, with approximately 14% increase over 24 hours
Gate News: On March 15, market data shows that CFX reached a new phase high on the 4-hour K-line chart, with prices touching approximately 0.06282 USDT at their peak, representing a 24-hour gain of around 14%. Some community members believe this rally may be related to recent macroeconomic catalysts. Earlier, media outlets citing sources reported that Iran is considering allowing certain tankers to pass through the Strait of Hormuz on the condition that petroleum transport be settled in Chinese yuan. Related discussions have once again sparked market attention toward yuan stablecoins and cross-border payment narratives.
GateNews3h ago
After the network upgrade: What prospects await SOL?
The official approval of protocol SIMD-0266 aims to optimize computing efficiency on the Solana network by introducing p-tokens, simplifying transaction processing. This upgrade, set for April, has prompted increased buying activity and could lead to significant cost reductions and performance improvements.
TapChiBitcoin4h ago
Track FET's journey to the $0.24 milestone as the AI cryptocurrency sector records its most positive trading week in months
The cryptocurrency industry related to AI has recently recorded an impressive performance. According to data from CoinMarketCap, the total market capitalization of this sector has grown 16% in just the past week. Many leading tokens in this category have also achieved significant growth, attracting
TapChiBitcoin4h ago