
Key Highlights
-
Bitcoin spot ETFs recorded $100M net inflow on Jan 15
-
Historical ETF inflows now exceed $58B
-
BTC confirmed an ascending triangle breakout
-
Price currently retesting breakout support near $95K
-
Measured move projects upside toward $108K
Bitcoin (BTC) is showing a mild pullback on January 16, 2026, trading around $95,500 after recently tagging a local high near $97,909 on January 14. The rally followed a mix of softer-than-expected U.S. inflation data and strong buying pressure from spot Bitcoin ETFs, both of which helped lift overall market sentiment.
While short-term price action reflects some cooling after the recent surge, the broader technical structure remains constructive, with the chart still favoring a continuation to the upside.
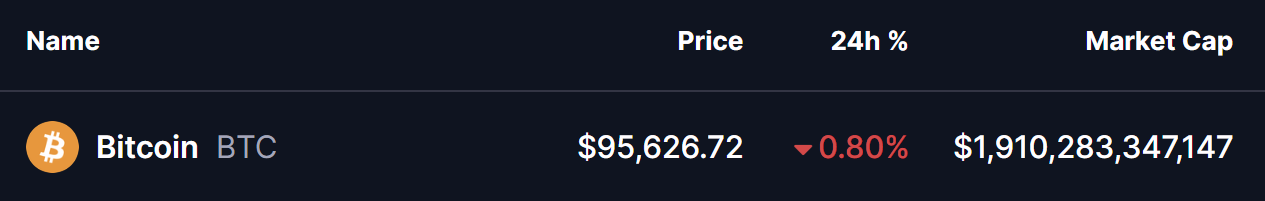
Source: Coinmarketcap
Bitcoin’s Positive ETF Inflows Signal Strong Institutional Demand
Institutional interest in Bitcoin remains robust. According to SoSoValue data, Bitcoin spot ETFs recorded a net inflow of $100 million on January 15, extending a streak of strong capital inflows.
Earlier this month, ETFs saw even larger buying activity, with $843 million, $753 million, and $116 million in inflows recorded up to January 12. This consistent demand highlights growing confidence among ETF investors, even as BTC consolidates near recent highs.
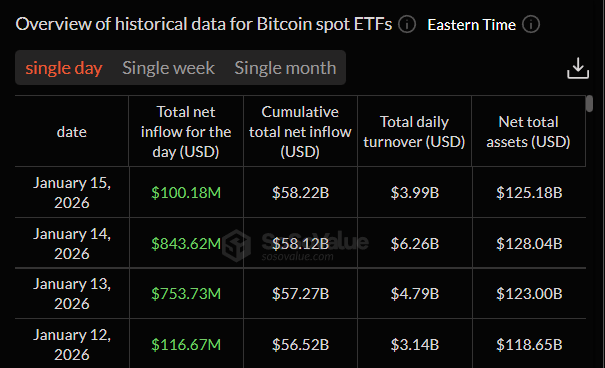
Source: SoSoValue
At press time, the total net asset value of Bitcoin spot ETFs stands at $125.18 billion, representing 6.58% of Bitcoin’s total market capitalization. Meanwhile, historical cumulative net inflows have reached $58.22 billion, reinforcing the idea that institutional participation continues to play a key role in supporting Bitcoin’s price.
Bitcoin Retesting a Key Breakout Zone
From a technical perspective, Bitcoin’s chart structure has improved meaningfully. On the daily timeframe, BTC recently broke out of an ascending triangle, a classic bullish continuation pattern characterized by higher lows pressing against a horizontal resistance level.
The breakout occurred around $94,700, followed by a strong impulse move toward the $97,900 region. This surge confirmed buyer dominance and shifted market structure firmly back in favor of bulls.
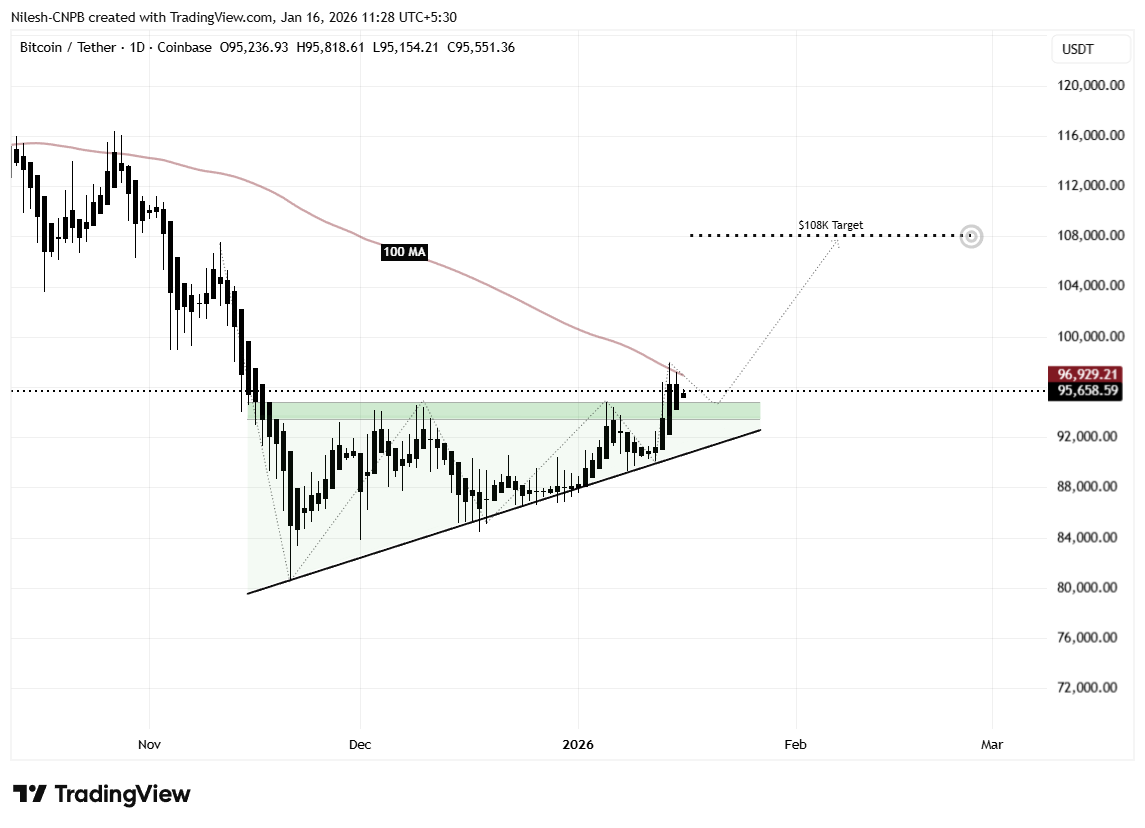
Bitcoin (BTC) Daily Chart/Coinsprobe (Source: Tradingview)
Currently, Bitcoin is trading slightly below the 100-day moving average, appearing to drift lower as part of a breakout retest. Such retests are generally considered healthy in trending markets and often act as confirmation that previous resistance has flipped into support — provided price holds above the former consolidation range.
What the Chart Suggests Next for BTC?
The ongoing pullback remains constructive as long as buyers continue to defend the mid-$95,000 support zone. Holding above this area would suggest that market participants are using the dip to accumulate rather than exit positions.
If bullish momentum resumes from this level, the first key objective would be a reclaim of the 100-day moving average near $96,929, followed by a retest of the $97,900 local high. A decisive push above that level would further strengthen bullish control and validate the breakout–retest structure.
Based on the measured move projection of the ascending triangle breakout, a successful continuation could send Bitcoin toward the $108,000 region. This target aligns with the extension shown on the chart and represents roughly 13% upside from the breakout area.
Bottom Line
The broader setup continues to lean bullish. Positive ETF net inflows, improving macro sentiment, a confirmed bullish chart pattern, and rising retail caution together create an environment that favors continuation rather than a deeper reversal.
While short-term volatility is expected after a strong rally, Bitcoin’s structure suggests that any controlled pullbacks may serve as a foundation for the next leg higher — potentially putting the $100K milestone back into focus in the weeks ahead.
Frequently Asked Questions (FAQ)
What is driving Bitcoin’s recent price strength?
Bitcoin’s recent strength is being supported by strong spot ETF inflows, improving macro sentiment after softer U.S. inflation data, and a confirmed bullish breakout on the daily chart.
How much money is flowing into Bitcoin spot ETFs?
Bitcoin spot ETFs recorded around $100 million in net inflows on January 15, following massive inflows of $843M, $753M, and $116M earlier in January, highlighting sustained institutional demand.
What technical pattern has Bitcoin formed?
Bitcoin has broken out of an ascending triangle pattern, a bullish continuation structure characterized by higher lows pressing against a resistance level. The current pullback appears to be a healthy retest of that breakout.
Why is the $95K level important for BTC?
The mid-$95K zone represents the breakout support area. As long as Bitcoin holds above this level, the bullish structure remains intact and favors continuation rather than reversal.
What is Bitcoin’s upside target based on the chart?
Based on the measured move from the ascending triangle breakout, Bitcoin could potentially rally toward the $108K region, representing roughly 13% upside from the breakout zone.
Disclaimer: The views and analysis presented in this article are for informational purposes only and reflect the author’s perspective, not financial advice. Technical patterns and indicators discussed are subject to market volatility and may or may not yield the anticipated results. Investors are advised to exercise caution, conduct independent research, and make decisions aligned with their individual risk tolerance.
About Author: Nilesh Hembade is the Founder and Lead Author of Coinsprobe, with over 5 years of experience in the cryptocurrency and blockchain industry. Since launching Coinsprobe in 2023, he has been providing daily, research-driven insights through in-depth market analysis, on-chain data, and technical research.
Disclaimer: The information on this page may come from third parties and does not represent the views or opinions of Gate. The content displayed on this page is for reference only and does not constitute any financial, investment, or legal advice. Gate does not guarantee the accuracy or completeness of the information and shall not be liable for any losses arising from the use of this information. Virtual asset investments carry high risks and are subject to significant price volatility. You may lose all of your invested principal. Please fully understand the relevant risks and make prudent decisions based on your own financial situation and risk tolerance. For details, please refer to
Disclaimer.
Related Articles
Crypto Market Drops As Fear Index Rises and Bitcoin Falls
The global crypto market has faced a decline, with a 4% dip in total market cap to $2.44T. Bitcoin and Ethereum dropped by 4.56% and 5.85%, respectively. Despite these declines, some cryptocurrencies saw significant gains, while DeFi and NFT metrics also fell.
BlockChainReporter31m ago
Tron Reserve Fund Holds 687 Million TRX as Price Retests Key Resistance Level
Tron purchased an additional 167.999 TRX, bringing its reserve fund to 687 million TRX as the price retests key resistance levels. Despite signs of price appreciation and increased stablecoin activity, the number of active users declined amid a broader market downturn.
TapChiBitcoin1h ago
Ripple CTO: Current XRP Price May Deviate from Market Expectations, but Will Be Corrected in the Long Term
Ripple Chief Technology Officer David Schwartz stated that despite XRP's role in the payments space and rising institutional adoption, its current price of approximately $1.50 may be undervalued, noting that market participants will exploit pricing discrepancies to correct the price.
GateNews2h ago
Bitcoin Breaks Below $71,000, Peter Brandt Warns of Two-Way Movement Risk
On March 19th, Bitcoin's price fell below $71,000, declining approximately 5% within 24 hours. Ethereum, Solana, and Dogecoin all dropped 5% to 6%, with total market capitalization evaporating over $100 billion. Senior traders point out that Bitcoin exhibits both bullish and bearish technical patterns, and macroeconomic factors are affecting market sentiment, with short-term trends remaining uncertain.
GateNews2h ago
Cardano (ADA) trades within a multi-year accumulation zone, with analysts monitoring its potential upside.
Cardano (ADA) is currently trading in the support zone of $0.18 to $0.25, which has historically bounced multiple times. Analysts point out that if this support holds and breaks through the downtrend line, ADA could rally to $1 and $3, representing gains of 270% and 1,011% respectively. Maintaining support is key to a bullish outlook.
GateNews2h ago
Bitcoin Briefly Falls Below $70,000 Mark During Asian Session as Fed Hawkishness and Macro Uncertainty Weigh on Market Volatility
Bitcoin fell below 70,000 on March 19, touching approximately 69,537, reflecting market concerns about the Federal Reserve maintaining high interest rates. Bitcoin subsequently rebounded to around 70,180, demonstrating psychological support at the 70,000 level. Despite improved market fund inflows, cryptocurrencies continue to face challenges amid global macroeconomic pressures, with 70,000 becoming a critical near-term level.
区块客2h ago
