The Kaspa (KAS) is trading around the $0.041 area as the new week begins, with price still struggling to regain momentum after a long corrective phase.
On the development side, Kaspa has continued to expand its real-world narrative. A new non-profit industrial initiative was launched last week to push Kaspa into regulated finance and supply chain use cases.
At the same time, analysts have pointed out that the KAS price needs to clear the $0.046 level to confirm a proper recovery.
The recent launch of K-Social has also added a utility layer to the ecosystem, showing Kaspa’s focus on censorship-resistant communication. Even with these developments, the KAS price remains under pressure on the chart.
- What the KAS chart is showing
- What market indicators are saying
- KAS price short-term outlook for this week
What the KAS chart is showing
On the 4H chart, Kaspa is clearly in a broader downtrend that began after the sharp sell-off in mid-October. That drop changed the structure of the market, and price has not managed to reclaim key resistance levels since.
After that major breakdown, the KAS price attempted a recovery toward the $0.060 area but failed to hold it. Since then, price has been moving lower in a controlled and steady manner. Over the past weeks, KAS has been moving sideways between $0.040 and $0.046.
Right now, price is sitting near the lower end of that range. Sellers have not pushed it much lower, but buyers are also not stepping in with strength yet.
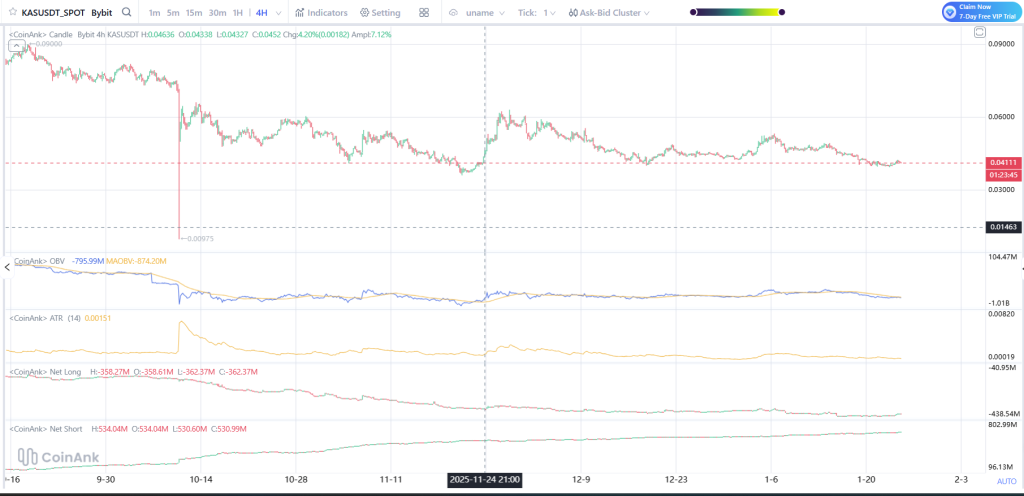
Source: Coinank
What market indicators are saying
OBV is still low, showing that strong buying has not returned yet. It has flattened lately, which means selling is slowing down, but real accumulation is still missing.
ATR has dropped since the big move in October, which tells us volatility is fading. This often happens before price makes its next larger move.
The position data shows that even more traders are taking a short position, and the long position is declining further, which is a confirmation that the overall sentiment of the market is bearish, even though the price is no longer dropping significantly.
Both of these indicate that the market is settling down, but it is not yet giving a clue of reversal.
_****SUI Moves Beyond the “Solana Killer” Label With a Privacy-First Shift**
KAS price short-term outlook for this week
Kaspa is supported in its range of $0.040 to $0.039. So long as it sustains, we consider it stable in terms of price.
If the KAS price rises and sustains its position past $0.046, then the resistance levels are $0.050 and then $0.055. Trespassing $0.055 will be the first clear sign for investors that prices are trying to move higher.
If KAS declines below $0.039, subsequent support levels are at around $0.035 and $0.030.
For the Kaspa price in the upcoming week, it is could range from $0.040 to $0.046. A rise above these values is expected to favor buyers, while a fall below $0.039 is expected to favor sellers.
Disclaimer: The information on this page may come from third parties and does not represent the views or opinions of Gate. The content displayed on this page is for reference only and does not constitute any financial, investment, or legal advice. Gate does not guarantee the accuracy or completeness of the information and shall not be liable for any losses arising from the use of this information. Virtual asset investments carry high risks and are subject to significant price volatility. You may lose all of your invested principal. Please fully understand the relevant risks and make prudent decisions based on your own financial situation and risk tolerance. For details, please refer to
Disclaimer.
Related Articles
HOT Climbs to $0.0004141, Its Falling Wedge Breakout Sets to Push Price 300% Higher: Analyst
The Holo (HOT) coin is showing bullish signals, with analysts predicting a significant price increase due to a breakout from a falling wedge pattern. Recent trends indicate rising interest and market activity, positioning HOT for potential gains soon.
BlockChainReporter22m ago
Bitcoin Cash Battles $459 Resistance as Massive Sell Walls Stack Toward $650
BCH is trading at $455.86 close to the resistance range of $459.20 with the support level of $447.44.
The chart data indicates that the chart has strong resistance levels at around $520, $580 and $650 which restricts the momentum on short term upside.
Following a sharp fall, price
CryptoNewsLand55m ago
HYPE Hits $35.53 After 2.4% Jump — Will Momentum Hold as Price Tests $35.59 Resistance?
Hyperliquid’s HYPE trades at $35.53, approaching the $35.59 resistance after a 2.4% daily gain.
The chart shows the $33.67 zone acting as support after price moved above a previously contested level.
Price now trades between $33.67 support and $35.59 resistance, shaping the immediate
CryptoNewsLand1h ago
Is Injective (INJ) a Dead Coin or the Next 2800% Opportunity? Here’s What The Chart Is Saying
The Injective price has fallen sharply from its previous all-time high, leading some traders to question whether the project has lost its momentum.
However, a recent technical analysis shared by top analyst Crypto Patel suggests that the recent decline may actually represent a typical
CaptainAltcoin2h ago
CFX 4-hour chart reaches a new high for the phase, with approximately 14% increase over 24 hours
Gate News: On March 15, market data shows that CFX reached a new phase high on the 4-hour K-line chart, with prices touching approximately 0.06282 USDT at their peak, representing a 24-hour gain of around 14%. Some community members believe this rally may be related to recent macroeconomic catalysts. Earlier, media outlets citing sources reported that Iran is considering allowing certain tankers to pass through the Strait of Hormuz on the condition that petroleum transport be settled in Chinese yuan. Related discussions have once again sparked market attention toward yuan stablecoins and cross-border payment narratives.
GateNews3h ago