
Key Takeaways
-
Fartcoin (FARTCOIN) is trading near $0.33 amid a broader crypto market sell-off driven by macro uncertainty.
-
The 4H chart shows a Bullish Bat harmonic pattern, often associated with short-term trend reversals.
-
Price has reacted positively from the D-point support near $0.288, hinting at seller exhaustion.
-
A breakout above the 50-period moving average around $0.374 could confirm bullish momentum.
-
Harmonic targets point toward $0.404 and $0.476 if the pattern plays out successfully.
-
A breakdown below $0.288 would invalidate the bullish setup.
As of January 19, 2026, Fartcoin (FARTCOIN) is trading slightly lower around $0.33, moving in line with the broader crypto market pullback. The sell-off was triggered by escalating US–EU trade tensions, which sparked nearly $875 million in long liquidations and pushed major assets like Bitcoin (BTC) and Ethereum (ETH) down more than 2% over the past 24 hours.
While FARTCOIN is down over 3% at the time of writing, the price action beneath the surface tells a more interesting story. The latest chart structure is now flashing a potential bullish harmonic setup, suggesting the current dip could be more of a setup than a breakdown.
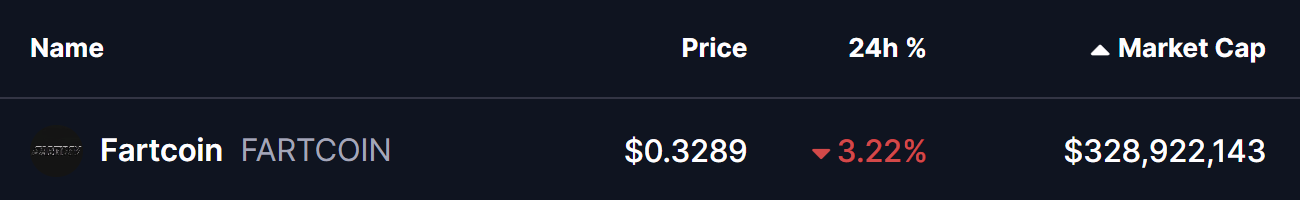
Source: Coinmarketcap
Harmonic Pattern Signals a Possible Reversal
On the 4-hour timeframe, Fartcoin is forming a well-defined Bullish Bat harmonic pattern, a structure often associated with short-term reversals after corrective phases.
The pattern began with the X point near $0.258, followed by a strong impulsive rally toward point A. Price then retraced to point B, rebounded to point C, and finally completed the structure at point D near $0.288. This D zone typically acts as the potential reversal area for the Bat pattern.
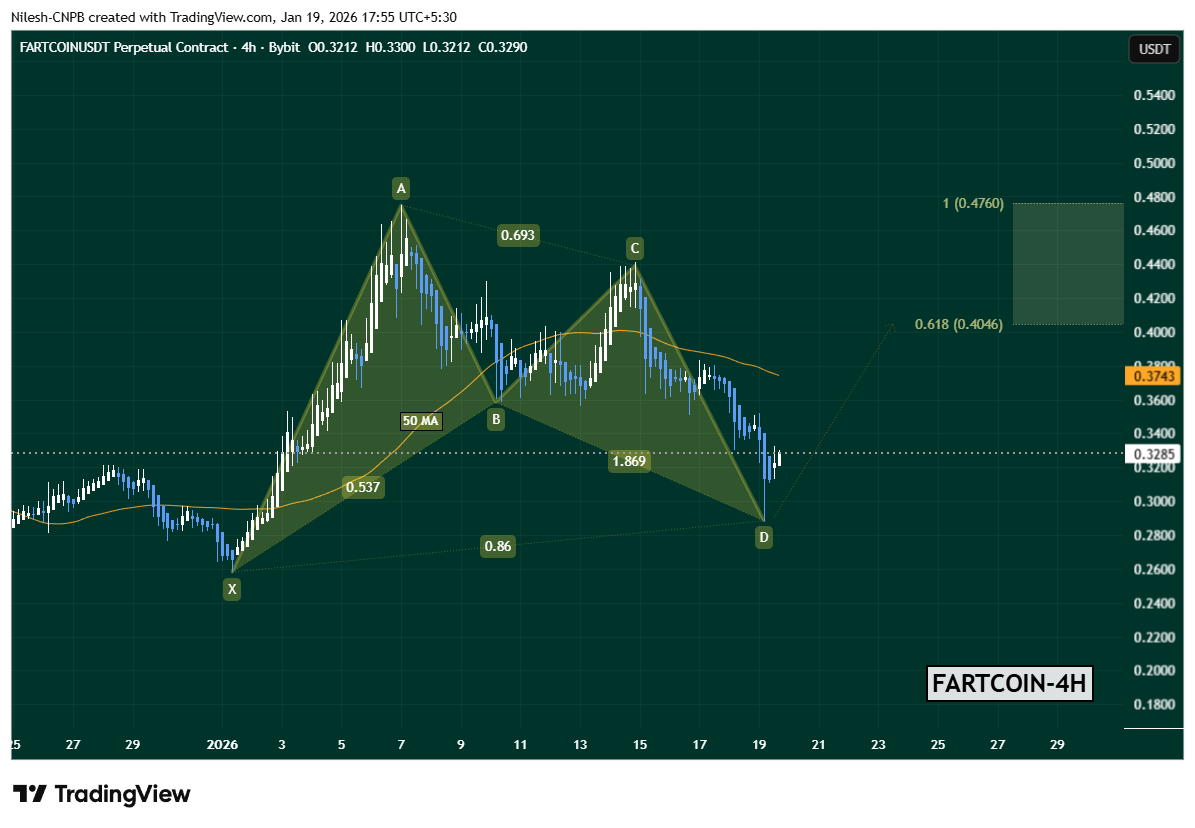
FARTCOIN Daily Chart/Coinsprobe (Source: Tradingview)
Following the completion of point D, FARTCOIN has already shown early signs of stabilization, bouncing back toward $0.3285. This initial reaction suggests that sellers may be losing momentum at current levels.
Key Levels That Could Decide the Move
One key level now in focus is the 50-period moving average, currently hovering around $0.3743. This level has acted as dynamic resistance in recent sessions and will likely determine whether the rebound gains traction or fades.
If buyers manage to push FARTCOIN above the 50 MA with improving volume, the harmonic projection opens the door for upside targets around:
This zone historically represents the area where Bat-pattern-driven moves tend to pause or face profit-taking.
On the flip side, the bullish setup remains valid only as long as price holds above the D-point support near $0.288. A decisive breakdown below this level would invalidate the harmonic structure and could expose FARTCOIN to deeper downside before any meaningful recovery attempt.
Bottom Line
Despite the ongoing market-wide weakness, Fartcoin’s chart is showing early signs of a technical rebound setup. The completion of a Bullish Bat harmonic pattern, combined with a developing bounce from key support, puts FARTCOIN at an important inflection point.
A breakout above the 50 MA could shift short-term momentum back in favor of the bulls, while failure to hold the D-point support would keep bears in control. For now, traders will be watching closely to see whether this harmonic signal translates into a sustained recovery or turns out to be another false start in a volatile market.
Disclaimer: The views and analysis presented in this article are for informational purposes only and reflect the author’s perspective, not financial advice. Technical patterns and indicators discussed are subject to market volatility and may or may not yield the anticipated results. Investors are advised to exercise caution, conduct independent research, and make decisions aligned with their individual risk tolerance.
About Author: Nilesh Hembade is the Founder and Lead Author of Coinsprobe, with over 5 years of experience in the cryptocurrency and blockchain industry. Since launching Coinsprobe in 2023, he has been providing daily, research-driven insights through in-depth market analysis, on-chain data, and technical research.
Disclaimer: The information on this page may come from third parties and does not represent the views or opinions of Gate. The content displayed on this page is for reference only and does not constitute any financial, investment, or legal advice. Gate does not guarantee the accuracy or completeness of the information and shall not be liable for any losses arising from the use of this information. Virtual asset investments carry high risks and are subject to significant price volatility. You may lose all of your invested principal. Please fully understand the relevant risks and make prudent decisions based on your own financial situation and risk tolerance. For details, please refer to
Disclaimer.
Related Articles
PEPE Consolidates Above $0.05324 Support as Momentum Strengthens and Resistance Near $0.05336 Holds
PEPE has a tight intraday price compression with a support level of $0.053243 and resistance level of $0.053363.
A RSI of 64.13 represents the moderate bullish momentum whereas MACD history is slightly positive, which indicates the gradual buying momentum.
The price is at $0.053364
CryptoNewsLand15m ago
HYPE Hits $35.53 After 2.4% Jump — Will Momentum Hold as Price Tests $35.59 Resistance?
Hyperliquid’s HYPE trades at $35.53, approaching the $35.59 resistance after a 2.4% daily gain.
The chart shows the $33.67 zone acting as support after price moved above a previously contested level.
Price now trades between $33.67 support and $35.59 resistance, shaping the immediate
CryptoNewsLand20m ago
Cardano áp sát mốc 0,28 USD khi lực mua nhỏ lẻ tăng mạnh – Đà bứt phá đã cận kề?
The current price of Cardano (ADA) is around $0.270, having risen from a support level of $0.254-$0.260. It underwent a dip to $0.2194 before buyers returned, leading to a structure indicating accumulation. The price tests resistance at $0.287, while whale activity raises market uncertainty. Despite a reduction in ADA holdings among large wallets, the supply remains concentrated in their hands, suggesting strategic liquidity reallocation rather than widespread selling. Meanwhile, retail investors continue accumulating ADA.
TapChiBitcoin2h ago
Bitcoin MVRV Z-Score Drops Below 1 Again
The MVRV Z-Score is a key on-chain indicator for assessing Bitcoin's value by comparing market and realized capitalizations. Historical data shows that when the score drops below 1, it often signals significant market recovery. However, changing market dynamics and institutional influences may alter future patterns.
Coinfomania3h ago
「刻舟求劍」式幣價預測走紅,玄學預言的實戰邏輯與缺陷
作者:Frank,PANews
每當市場進入不上不下的迷惘階段,就會有人試圖用「刻舟求劍」式的歷史回溯方法去預測下一段走勢。在這種情況下,人們往往能從這些理論和圖表中看到歷史總是在重演,並似乎自動將未來一段時間的行情走勢與過去的某一段進行重疊驗證。
這種重合似乎有著神奇的效果,也常常被驗證。有部落客自稱這種預測的準確率能到達 75%~80% 。
這種在社群媒體上屢屢爆紅的「刻舟求劍」式價格預測,究竟是在幫助市場識別階段,還是在把噪音包裝成預言?
從「滴答分形」到「歷史押韻」
關於 2025 年 10 月市場頂點預測的巔峰操作是名為 CryptoBullet 的分析師,他所創建的一種名為「ti
区块客4h ago
Dogecoin (DOGE) Prints Abnormal $0 as Short Sellers Disappear - U.Today
Dogecoin's recent rally saw $0 in short liquidations, indicating traders were betting long. Despite a 4.61% decline due to market pullback, volume remained high. The potential for DOGE to reach $0.10 depends on Bitcoin's recovery.
UToday4h ago