
Key Takeaways
-
SUI has dropped nearly 67% from its recent peak, placing it in a potential bottoming zone.
-
Current price action closely mirrors Solana’s 2025 bottoming fractal, which preceded a strong reversal.
-
A reclaim of the 50-day moving average could confirm a trend shift and open the door for a broader recovery.
SUI, the native token of Sui’s Layer-1 blockchain, has struggled to live up to its early hype in recent months, especially when compared to** Solana’s (SOL)** 2021 explosive performance. A broader market correction has only added pressure, dragging SUI nearly 50% lower over the past 90 days.
But zooming out and looking beneath the surface, the current price structure tells a more interesting story. On the charts, SUI is starting to resemble a bottoming fractal previously seen in Solana—a setup that eventually led to a sharp and sustained upside move.
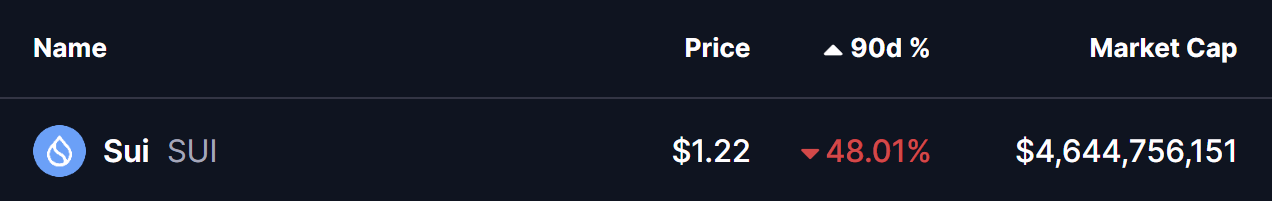
Source: Coinmarketcap
SUI Mirrors SOL’s Bottoming Path
A side-by-side comparison of SUI and SOL reveals striking similarities.
Back in early 2025, **Solana **topped near $295 before entering a sharp corrective phase. Price slipped below the 50-day moving average, signaling weakening momentum. The sell-off eventually stretched into a deep 67% drawdown, flushing out late longs and marking a clear sentiment reset.
That low proved pivotal.
Once SOL reclaimed its 50-day moving average, the trend structure flipped. What followed was a 163% rally, one of the most notable reversals of 2025.
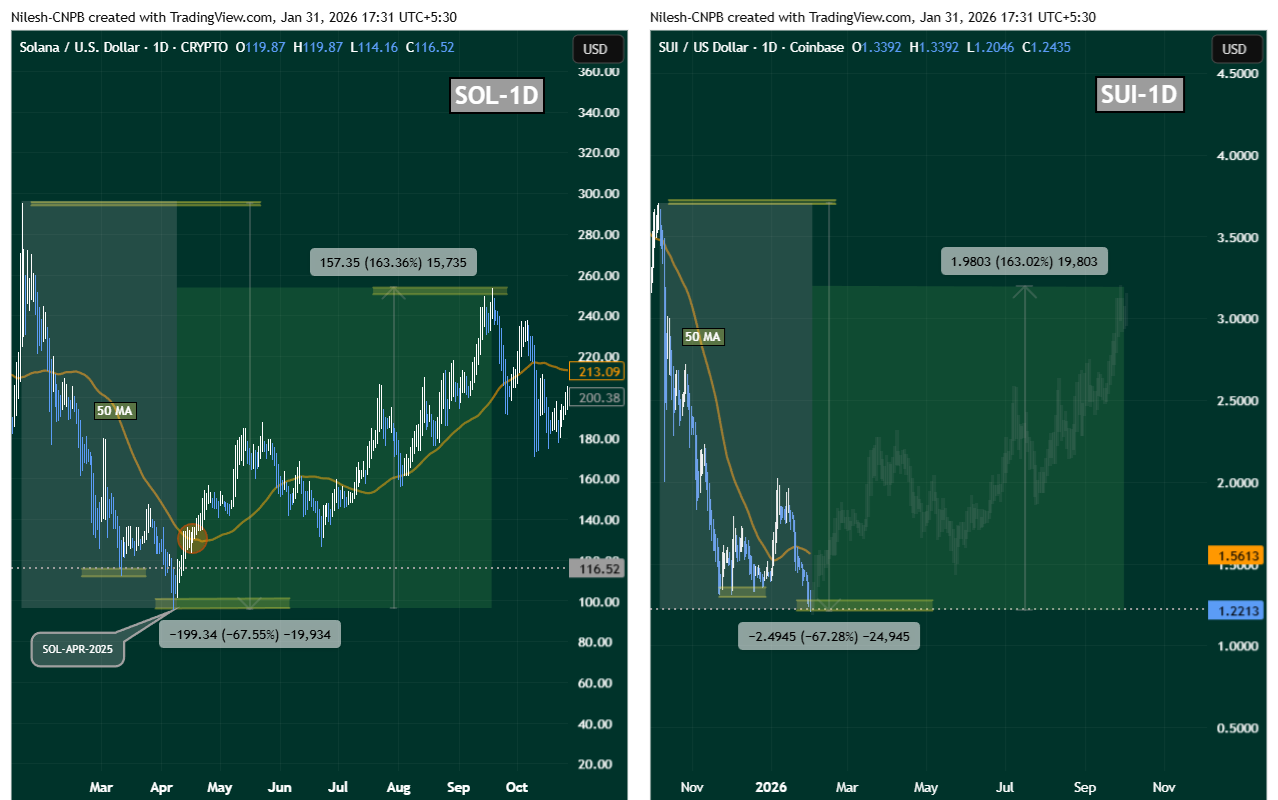
SOL and SUI Fractal Chart/Coinsprobe (Source: Tradingview)
SUI now appears to be following a similar script.
After peaking around $3.70 in October 2025, SUI entered a steep correction, losing its 50-day moving average and sliding into a nearly identical 67% drawdown. Momentum faded, volatility compressed, and price action began to flatten—classic characteristics of a market searching for a base.
What’s Next for SUI?
From a technical perspective, SUI is now sitting near a critical inflection zone around $1.20–$1.22, an area that could act as a potential bottom if buyers continue to defend it.
The first major confirmation bulls will want to see is a reclaim of the 50-day moving average, currently hovering near $1.56. A sustained move above this level would signal that bearish momentum is fading and that buyers are regaining control.
If that reclaim occurs, SUI could transition into a broader recovery phase. In a scenario where the SOL fractal continues to play out, upside expansion toward the $3.00–$3.20 region would come back into focus over the medium term.
Key Risk Note
While fractal comparisons can offer valuable context, they are not guarantees. Each asset trades within its own liquidity environment, sentiment cycle, and macro backdrop. For SUI, confirmation still matters—especially through moving average reclaims and consistent follow-through buying.
Until then, the structure suggests risk is compressing, not expanding.
Disclaimer: The views and analysis presented in this article are for informational purposes only and reflect the author’s perspective, not financial advice. Technical patterns and indicators discussed are subject to market volatility and may or may not yield the anticipated results. Investors are advised to exercise caution, conduct independent research, and make decisions aligned with their individual risk tolerance.
About Author: Nilesh Hembade is the Founder and Lead Author of Coinsprobe, with over 5 years of experience in the cryptocurrency and blockchain industry. Since launching Coinsprobe in 2023, he has been providing daily, research-driven insights through in-depth market analysis, on-chain data, and technical research.
Disclaimer: The information on this page may come from third parties and does not represent the views or opinions of Gate. The content displayed on this page is for reference only and does not constitute any financial, investment, or legal advice. Gate does not guarantee the accuracy or completeness of the information and shall not be liable for any losses arising from the use of this information. Virtual asset investments carry high risks and are subject to significant price volatility. You may lose all of your invested principal. Please fully understand the relevant risks and make prudent decisions based on your own financial situation and risk tolerance. For details, please refer to
Disclaimer.
Related Articles
Crypto Market Update – River and Hyperliquid Lead Gainers As Decentralized Infrastructure Gains M...
The crypto market is displaying its typical volatility once again, yet under the noise of price movements, the beginnings of a narrative are starting to take shape. As of today, the “Top Gainers” on CoinMarketCap leans heavily towards projects targeting decentralized infrastructure and fast Layer-1s
BlockChainReporter9m ago
Solana Approaches Key Sell Wall at $84.78 — Will Momentum Hold for a Move Toward $89?
Solana is trading at an approximate price of $83.18, although a solid sell wall is at an approximate price of $84.78, which prevents upward movement.
The price is trapped between the support at $81.99 and the resistance at $84.78 which is short term consolidation.
Once buyers hit the
CryptoNewsLand38m ago
SOL Consolidates Near $84 While Chart Highlights Possible $45 Demand Zone
Solana (SOL) trades at $83.87 within a range defined by $81.03 support and $84.43 resistance, showing consolidation below a $90 supply zone. There is a broader demand area near $45, indicating potential downward movement before recovery.
CryptoNewsLand43m ago
Santiment: The surge in active USDT addresses on a certain public blockchain is correlated with the rebound of BTC
Research firm Santiment found that over the past year, when USDT active addresses on a certain public blockchain surged three times, BTC price rebounded each time, indicating that USDT liquidity has a significant impact on BTC price.
GateNews1h ago
PEPE Consolidates Above $0.05324 Support as Momentum Strengthens and Resistance Near $0.05336 Holds
PEPE has a tight intraday price compression with a support level of $0.053243 and resistance level of $0.053363.
A RSI of 64.13 represents the moderate bullish momentum whereas MACD history is slightly positive, which indicates the gradual buying momentum.
The price is at $0.053364
CryptoNewsLand1h ago
Michael Saylor: Strategy - There is a time lag between buying Bitcoin and price appreciation
Gate News reports that on March 12, Strategy founder Michael Saylor posted: "There is a time lag between when we purchase Bitcoin and when the Bitcoin price skyrockets."
GateNews2h ago