
Key Takeaways
-
Monad (MON) has dropped nearly 41% over the past two months but is showing early signs of stabilization.
-
Price action suggests a potential double bottom pattern forming near the $0.018 support zone.
-
Buyers have repeatedly defended the same support level, hinting at fading selling pressure.
-
A move above the 50-day moving average could strengthen the short-term bullish outlook.
-
A confirmed breakout above the $0.02970 neckline may open the door for a stronger recovery rally.
Monad (MON), the native token of the Monad Layer-1 blockchain, has been under pressure in recent weeks. The token is down roughly 41% over the past 60 days, driven by a slowdown in TVL growth and a decline in application-level revenue across the ecosystem.
However, sentiment may be starting to shift. MON posted a 12% bounce today, and more importantly, its price structure on the daily chart is beginning to show early signs of a bullish reversal — suggesting the downside momentum could be losing steam.
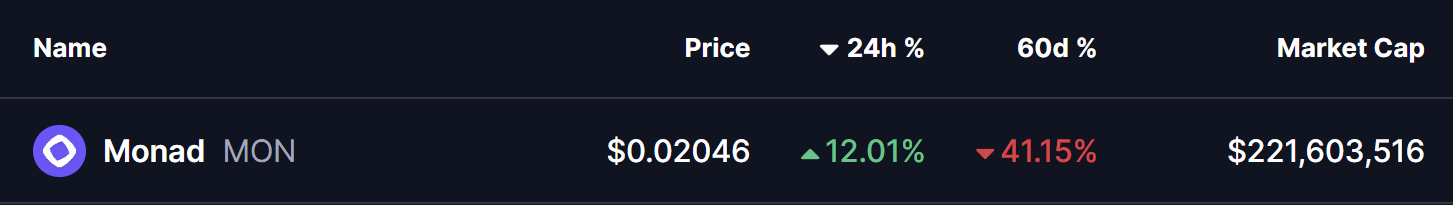
Source: Coinmarketcap
Double Bottom Pattern in Play
On the daily timeframe, MON appears to be forming a potential double bottom pattern, a classic bullish reversal structure that often develops near the end of extended downtrends.
The first bottom was formed when MON dropped toward the $0.018 support zone, followed by a rebound that carried price back toward the neckline resistance near $0.02970. That recovery attempt was rejected, sending MON back down to retest the same support level.
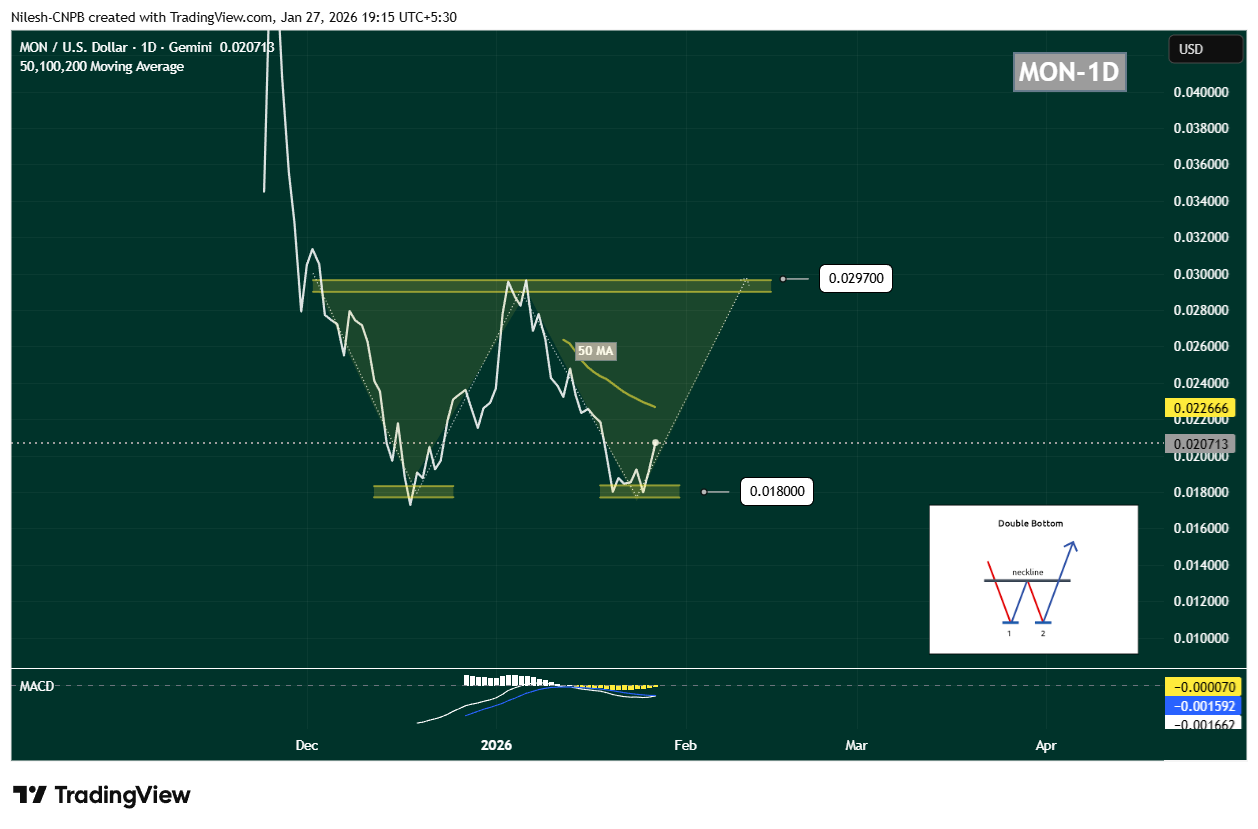
Monad (MON) Daily Chart/Coinsprobe (Source: Tradingview)
What’s notable this time is buyer behavior. Once again, demand emerged around $0.018, preventing a breakdown and forming the second bottom of the structure. MON is currently trading near $0.02071, indicating that selling pressure may be fading.
Momentum indicators are starting to support this view. The MACD is showing early signs of a potential bullish crossover, often seen as an initial signal that downside momentum is weakening and buyers may be preparing to step back in.
What’s Next for Monad (MON)?
For this bullish setup to gain credibility, MON needs to reclaim the 50-day moving average, which is currently positioned near $0.02266. A sustained move above this level would signal a shift in short-term momentum and improve the probability of a recovery rally.
If buyers manage to push price back toward the $0.02970 neckline, the market will be watching closely. A decisive breakout above this resistance, ideally followed by a successful retest, would confirm the double bottom pattern and open the door for a stronger upside move.
On the downside, the $0.018 support zone remains the most critical level to defend. A breakdown below this area would invalidate the bullish structure and likely expose MON to another leg of downside or extended consolidation.
Bottom Line
Despite recent weakness, MON’s technical structure is starting to look constructive. The repeated defense of identical lows, the emergence of a double bottom pattern, and improving momentum signals suggest that Monad could be approaching a potential turning point.
If key support continues to hold and the token reclaims its short-term moving averages, MON may be setting the stage for a recovery phase — especially if broader market conditions stabilize in the days ahead.
Disclaimer: The views and analysis presented in this article are for informational purposes only and reflect the author’s perspective, not financial advice. Technical patterns and indicators discussed are subject to market volatility and may or may not yield the anticipated results. Investors are advised to exercise caution, conduct independent research, and make decisions aligned with their individual risk tolerance.
About Author: Nilesh Hembade is the Founder and Lead Author of Coinsprobe, with over 5 years of experience in the cryptocurrency and blockchain industry. Since launching Coinsprobe in 2023, he has been providing daily, research-driven insights through in-depth market analysis, on-chain data, and technical research.
Disclaimer: The information on this page may come from third parties and does not represent the views or opinions of Gate. The content displayed on this page is for reference only and does not constitute any financial, investment, or legal advice. Gate does not guarantee the accuracy or completeness of the information and shall not be liable for any losses arising from the use of this information. Virtual asset investments carry high risks and are subject to significant price volatility. You may lose all of your invested principal. Please fully understand the relevant risks and make prudent decisions based on your own financial situation and risk tolerance. For details, please refer to
Disclaimer.
Related Articles
Here’s Why River (RIVER) Price Is Pumping Today
RIVER's price surged 25% to $27.54, driven by a bullish inverse head-and-shoulders breakout and increased trading volume. Analysts project further gains as traders respond to market conditions and ongoing ecosystem campaigns, indicating strong support for the price.
CaptainAltcoin2h ago
Brandt Spotlights 'Ugly' Bitcoin Pattern - U.Today
Peter Brandt advises Bitcoin traders to remain flexible amidst conflicting technical setups: a potential bullish "horn" pattern and a bearish "flag" pattern. He criticizes the dogmatic mindset of some in the crypto community, emphasizing adaptable trading strategies over fixed opinions.
UToday3h ago
XRP Ledger Hits 7.7M Holders as Price Jumps 14%
XRP Ledger's adoption hit 7.7 million wallets after 13 years, with a surge in active addresses to 46,767 as its price rose 14%. The cryptocurrency now faces resistance at $1.55–$1.70, indicating a cautious upward trend.
CryptoFrontNews3h ago
AHR999 Index Falls Below 0.45 for First Time in 837 Days
Gate News bot message, The AHR999 Index has dropped below 0.45, marking the first occurrence in 837 days. This level was last observed in February 2026. Prior to that, the index reached this zone in October 2023, preceding the price movement from $28K to $72K. The source notes this is not a buy sign
GateNews5h ago
XRP Supply Shift: Whales Add 200 Million Tokens as Price Eyes $1.50 - U.Today
XRP has seen a significant increase in whale activity, with 200 million XRP bought recently, while network activity and wallet numbers reach new highs. A "golden cross" signals potential price rises, as the SEC clarifies crypto asset regulations.
UToday7h ago
