
Key Takeaways
-
Hyperliquid (HYPE) surged over 8%, reclaiming the $23.30 level amid rising market interest.
-
DefiLlama data shows Hyperliquid leading perpetual futures volume over the last 30 days, topping $160 billion.
-
Strong derivatives activity suggests sustained trader demand and growing ecosystem traction.
-
The daily chart highlights a Bearish Shark harmonic pattern, allowing room for short-term upside.
Hyperliquid’s native token, HYPE, is back in the spotlight today after posting a 8%+ price jump, pushing above the $23.30 level. While the price move itself has caught traders’ attention, a deeper look at on-chain metrics and the daily chart suggests there may be more developing beneath the surface.
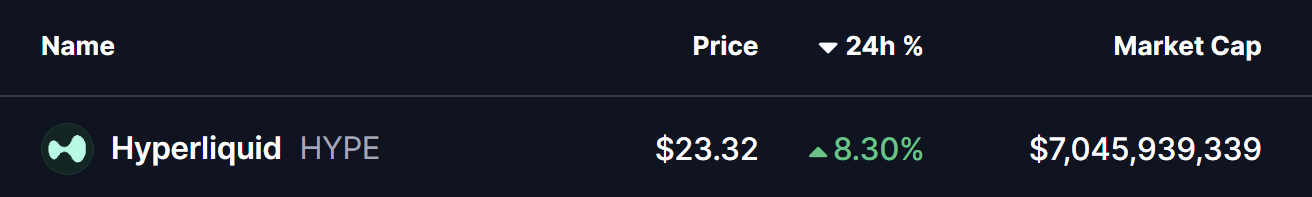
Source: Coinmarketcap
Hyperliquid (HYPE) Leads Perp Volume
According to DefiLlama data, **Hyperliquid **has emerged as the **top perpetual futures **platform by trading volume over the last 30 days, significantly outperforming its closest competitors. The protocol recorded approximately $160.4 billion in perpetual volume, comfortably ahead of Aster and Lighter, which logged around $124.7 billion and $112.5 billion, respectively.
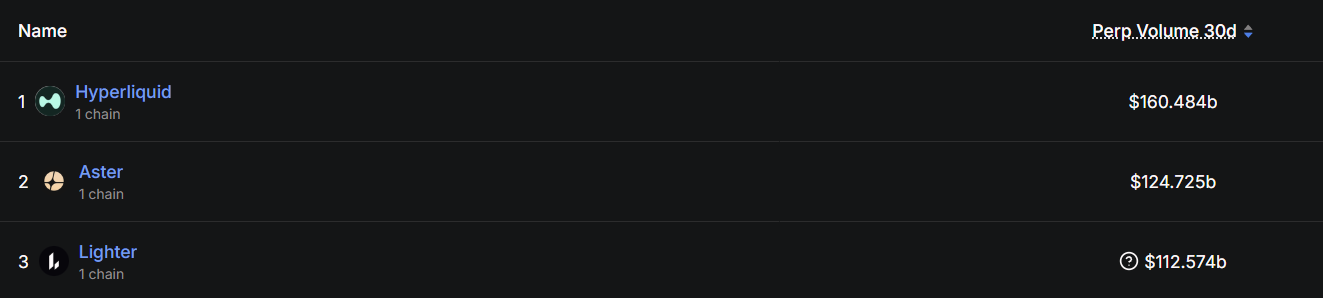
Source: Defillama
This surge in activity highlights growing trader preference for Hyperliquid’s ecosystem, signaling strong demand, deep liquidity, and sustained engagement. Historically, rising derivatives volume often acts as a leading indicator for increased interest in a project’s native token — something that appears to be playing out in HYPE’s recent price action.
Is More Upside Ahead?
From a technical perspective, HYPE’s daily chart reveals the development of a Bearish Shark harmonic pattern, a well-known formation in technical analysis. While this pattern ultimately suggests a potential reversal once fully completed, it often allows for short-term bullish continuation as price moves toward the “C” point.
Following the completion of the O-X-A-B structure, HYPE is currently trading around $23.26, holding above its recent lows. The next key challenge for bulls lies at the 50-day moving average near $25.72, which has acted as a dynamic resistance zone.
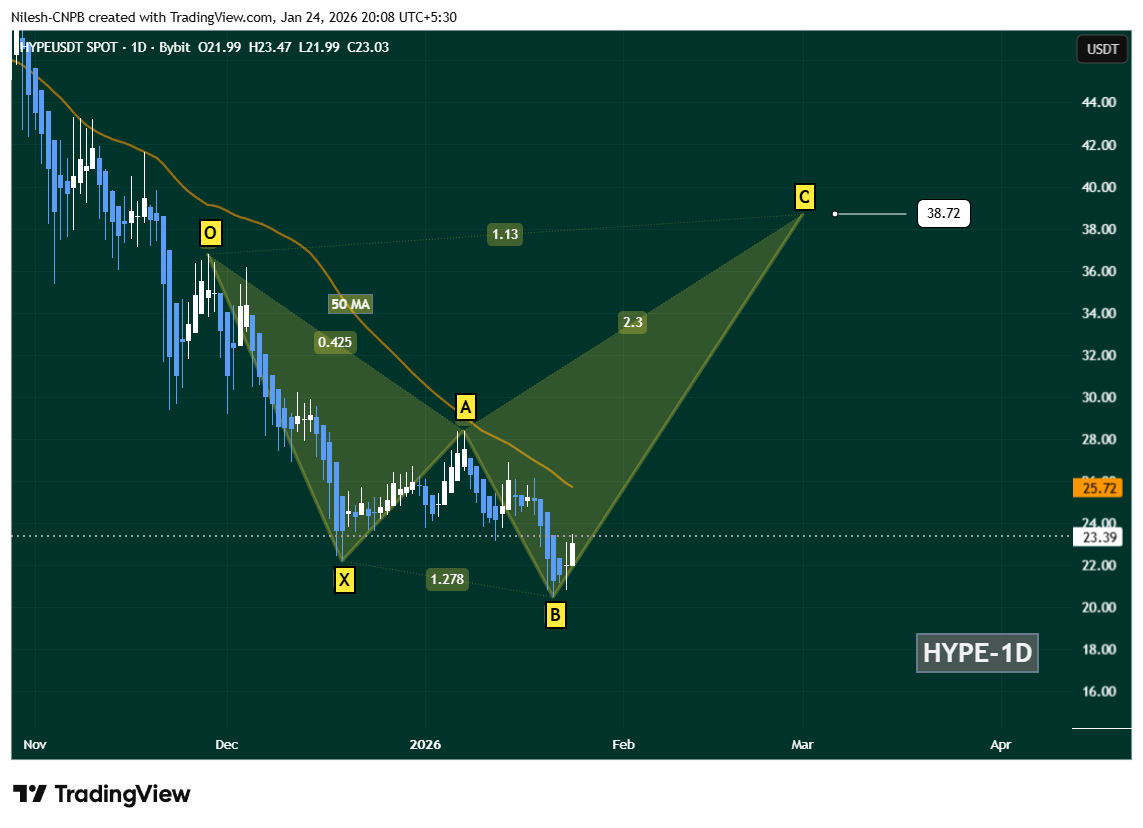
Hyperliquid (HYPE) Daily Chart/Coinsprobe (Source: Tradingview)
A decisive daily close above the 50-day MA ($25.72) would strengthen the recovery narrative and could open the door for a broader upside move. If momentum continues to build, the chart projects a potential advance toward the C-point near $38.72, aligning with the Shark pattern’s 1.13 Fibonacci extension.
However, downside risks remain. A failure to hold the B-point support zone would invalidate the bullish continuation setup and could expose HYPE to extended consolidation or further downside pressure in the near term.
Bottom Line
HYPE’s price rebound is being backed by strong on-chain fundamentals, with Hyperliquid clearly dominating the perpetual trading landscape. While the broader harmonic structure suggests caution in the longer term, short-term technicals still favor a recovery move as long as key support levels remain intact. All eyes now remain on the $25.72 reclaim, which could act as the trigger for the next leg higher.
Disclaimer: The views and analysis presented in this article are for informational purposes only and reflect the author’s perspective, not financial advice. Technical patterns and indicators discussed are subject to market volatility and may or may not yield the anticipated results. Investors are advised to exercise caution, conduct independent research, and make decisions aligned with their individual risk tolerance.
About Author: Nilesh Hembade is the Founder and Lead Author of Coinsprobe, with over 5 years of experience in the cryptocurrency and blockchain industry. Since launching Coinsprobe in 2023, he has been providing daily, research-driven insights through in-depth market analysis, on-chain data, and technical research.
Disclaimer: The information on this page may come from third parties and does not represent the views or opinions of Gate. The content displayed on this page is for reference only and does not constitute any financial, investment, or legal advice. Gate does not guarantee the accuracy or completeness of the information and shall not be liable for any losses arising from the use of this information. Virtual asset investments carry high risks and are subject to significant price volatility. You may lose all of your invested principal. Please fully understand the relevant risks and make prudent decisions based on your own financial situation and risk tolerance. For details, please refer to
Disclaimer.
Related Articles
Bitcoin Approaches $75,000 Mark: Short Covering Drives Rally, Fed Decision in Focus
On March 17th, Bitcoin touched $75,912 at one point but subsequently pulled back to $74,372, indicating that selling pressure remains. Mainstream crypto assets posted widespread gains for the week, with Ethereum up 13.3%. Market analysis indicates that recent gains have been primarily driven by the derivatives market, with institutional capital inflows supporting the market. However, uncertainty in macroeconomic policy will impact subsequent price movements.
GateNews1m ago
Shiba Inu Price Steady Amid Shytoshi Kusama’s X Silence and Bio Changes
Shiba Inu price remains steady while the community watches Kusama’s activity on X.
Kusama’s bio update hints at ongoing development, sparking speculation among SHIB followers.
SHIB shows minor rebounds amid broader market volatility and improving overall crypto sentiment.
Shiba Inu has h
CryptoNewsLand3m ago
This Crypto Trader Predicts Where the Zcash (ZEC) Price Is Headed Next
The ZEC price just ripped 15% higher in the last 24 hours, landing back among the top crypto gainers. The privacy coin is now trading just slightly below $270 after breaking out of a descending trendline that had held for months.
Analyst “Ardi” shared the chart on X, breaking down where the
CaptainAltcoin9m ago
Bitcoin ETF Six Consecutive Gains: Nearly 1 Billion USD Fund Inflow Drives BTC Rally Over 12%
On March 17, U.S. spot Bitcoin ETFs experienced net inflows for the sixth consecutive trading day, driving Bitcoin prices up more than 12%. Total net inflows reached $962.8 million, primarily supported by BlackRock and Fidelity. Despite smaller inflow scales, the sustained momentum has improved investor sentiment. Analysts believe short-term price movements are influenced by capital inflows and macroeconomic changes.
GateNews45m ago
TRUMP Token Whales Hit Five-Month High, Trump Dinner Effect Drives 36% Surge
Trump meme coin TRUMP surged approximately 36% following the announcement of an exclusive dinner event, with whale holdings reaching a five-month high. Large holders are actively increasing positions, but losses are also present in the market, indicating divergent investment behavior. Controversy sparked by political criticism may have limited impact on market performance, but regulatory investigation risks remain a concern to monitor.
MarketWhisper1h ago
Bitcoin Spot ETF Saw $760 Million in Inflows Last Week! But Whether the Rally Continues Requires Monitoring 3 Key Factors
US cryptocurrency spot ETFs showed a significant rebound last week, with Bitcoin and Ethereum recording net inflows of approximately $763.4 million and $160.9 million respectively, with prices bouncing back accordingly. Although the market is showing incremental buying signals, it still faces variables from central bank policies and geopolitical risks in the future. The market will continue to monitor ETF capital inflows and macroeconomic impacts.
CryptoCity1h ago
