
Key Takeaways
-
Ethereum ($ETH) has broken below the critical $2,637 support, signaling a shift in short-term market structure.
-
Price is now trading near $2,400, posting an 11.10% daily loss and a 18% year-to-date decline.
-
The current price action mirrors a bearish fractal from August 2024, raising the risk of further downside.
-
If selling pressure persists, ETH could slide toward the $2,128 support zone, where buyers may attempt a defense.
Ethereum ($ETH), the second-largest cryptocurrency by market capitalization, is once again under heavy selling pressure. As of January 31, 2026, ETH has slipped near the $2,400 mark, printing an 11.10% decline in the last 24 hours and extending its year-to-date losses to 18.73%, while also marking a fresh yearly low.
The sharp move lower has shifted short-term sentiment firmly in favor of the bears, with both price structure and derivatives data flashing warning signs.
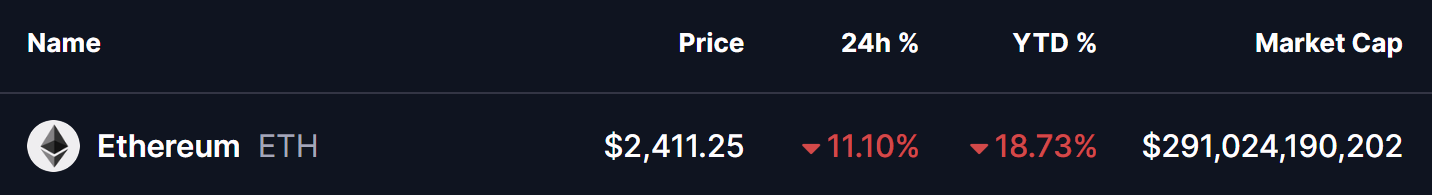
Source: Coinmarketcap
Liquidations Soar as Bulls Get Trapped
The downside move has been amplified by aggressive liquidations across the derivatives market. Recent data shows over $553 million worth of ETH positions liquidated, with a striking $523 million coming from long positions, compared to just $30 million in shorts over the past 24 hours.
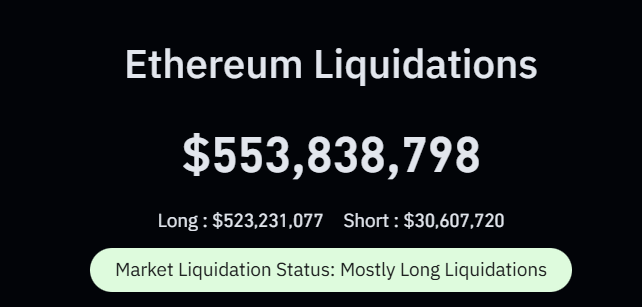
Ethereum (ETH) Liquidations/Source: Coinglass
This imbalance highlights a classic scenario of over-leveraged bulls getting flushed out, where forced sell orders accelerate downside momentum. When liquidations skew this heavily toward longs, price often struggles to find immediate relief, as dip buyers hesitate and momentum traders press their advantage.
Bears Take Control on the Daily Chart
From a technical perspective, Ethereum’s daily chart paints a concerning picture. ETH has decisively lost the $2,637 horizontal support, a level that previously acted as a floor during consolidation. Once this zone gave way, selling pressure intensified, dragging price swiftly toward the $2,400 region.
What makes this move particularly notable is its resemblance to a previous downside fractal visible on the chart. Back in August 2024, ETH broke a similar support structure, triggering a sharp continuation move that ultimately drove price into a deeper corrective phase before buyers finally stepped in.
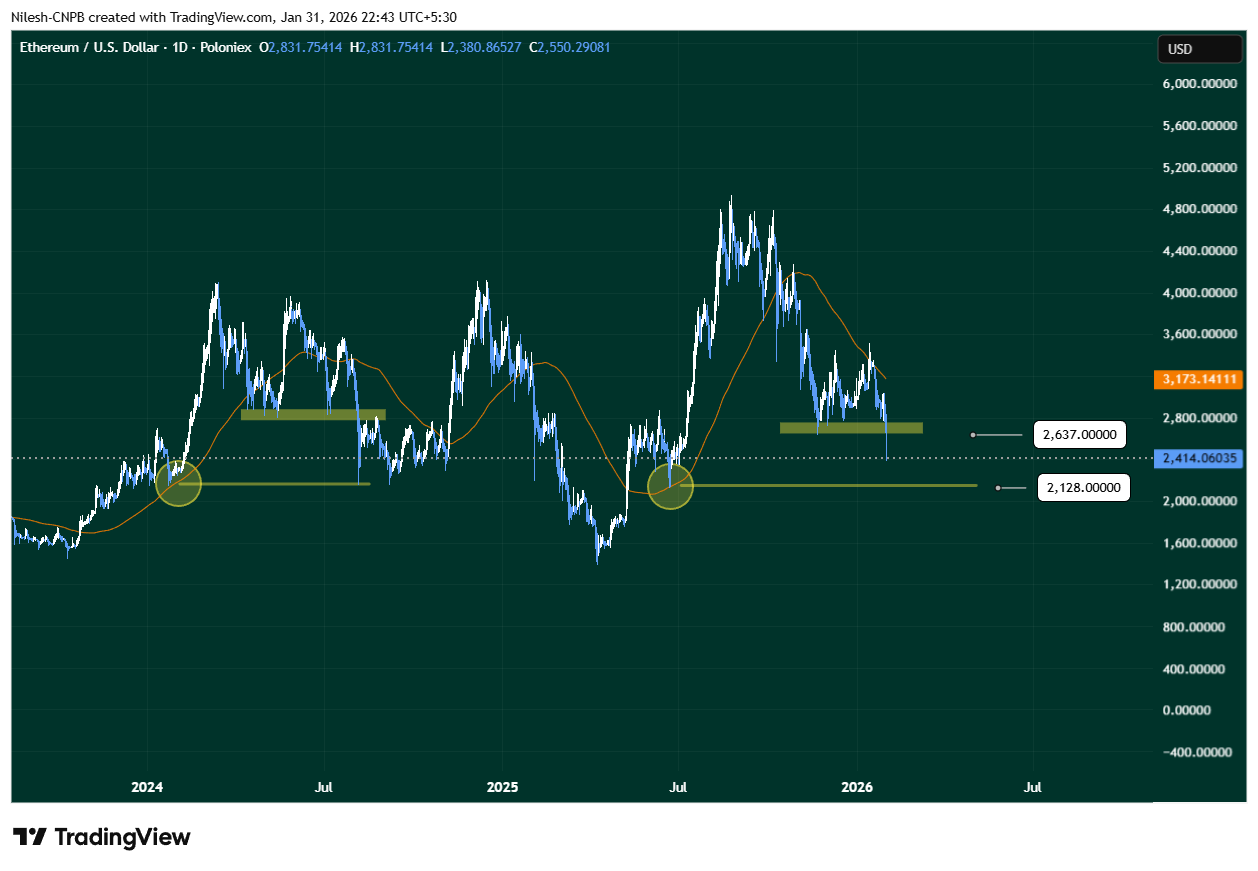
Ethereum (ETH) Daily Chart/Coinsprobe (Source: Tradingview)
The current structure appears to be echoing that same behavior—support break, rapid downside expansion, and limited bounce attempts so far.
More Pain Ahead?
If this historical fractal continues to play out, Ethereum could be heading toward its next major support near $2,128, a zone that previously attracted strong demand. This level stands out as a potential area where longer-term buyers may begin to show interest, especially if broader market conditions stabilize.
On a flip side, a strong reclaim of the $2,637 resistance zone, followed by acceptance above it, would invalidate the current fractal setup and suggest that today’s breakdown was a false move. Such a recovery would likely force late shorts to cover and could stabilize price action.
For now, however, Ethereum remains vulnerable. With heavy long liquidations, broken support, and a familiar bearish pattern resurfacing on the chart, the path of least resistance appears tilted to the downside—at least in the short term.
Disclaimer: The views and analysis presented in this article are for informational purposes only and reflect the author’s perspective, not financial advice. Technical patterns and indicators discussed are subject to market volatility and may or may not yield the anticipated results. Investors are advised to exercise caution, conduct independent research, and make decisions aligned with their individual risk tolerance.
About Author: Nilesh Hembade is the Founder and Lead Author of Coinsprobe, with over 5 years of experience in the cryptocurrency and blockchain industry. Since launching Coinsprobe in 2023, he has been providing daily, research-driven insights through in-depth market analysis, on-chain data, and technical research.
Disclaimer: The information on this page may come from third parties and does not represent the views or opinions of Gate. The content displayed on this page is for reference only and does not constitute any financial, investment, or legal advice. Gate does not guarantee the accuracy or completeness of the information and shall not be liable for any losses arising from the use of this information. Virtual asset investments carry high risks and are subject to significant price volatility. You may lose all of your invested principal. Please fully understand the relevant risks and make prudent decisions based on your own financial situation and risk tolerance. For details, please refer to
Disclaimer.
Related Articles
A major trader closed a position of 40,000 ETH 2 hours ago, earning a profit of $14.8 million.
On March 17th, on-chain analyst Yu Jin detected a whale trader taking profit on 40,000 ETH after ETH rose 8%, earning $14.8 million. The trader previously opened a long position worth $290 million on Hyperliquid, which has already generated $47.92 million in profits. The trader currently still holds 80,000 ETH and 700 BTC long positions.
GateNews5m ago
3/16 Price Forecast:SPX, DXY,BTC,ETH,BNB, XRP, SOL, DOGE, ADA, HYPE
Bitcoin (CRYPTO: BTC) pressed toward a key resistance near $74,508, a level that traders are watching closely for signs of a sustained breakout. The move arrived as on-chain indicators suggested renewed buying interest from mid-sized wallets, with addresses holding between 10 and 10,000 BTC
CryptoBreaking49m ago
Robert Kiyosaki Predicts Bitcoin $750K, Ethereum $95K After Global Financial Crash
Robert Kiyosaki warns a massive asset bubble could soon burst, predicting an unprecedented market collapse that may propel gold, silver, bitcoin, and ethereum to extraordinary valuations within a year of a global financial crisis.
Robert Kiyosaki Expects Bitcoin, Ethereum to Explode After
Coinpedia1h ago
ETH drops 0.78% in 15 minutes: Institutional large transfers and liquidity contraction trigger short-term sell pressure
On March 16, 2026, from 23:00 to 23:15 (UTC), the price of ETH dropped by 0.78% in a short period, with fluctuations ranging from 2330.62 to 2357.98 USDT, and an amplitude of 1.16%. Market volatility during this period intensified significantly, trading activity increased markedly, and bearish sentiment began to spread.
The main driver of this movement was large institutional funds transferring to a major exchange within 15 minutes, with single transfers exceeding $10 million, totaling 21,400 ETH. These transfers caused a sudden increase in ETH supply on trading platforms, further amplified by the current market conditions.
GateNews1h ago
