
Key Takeaways
-
Virtuals Protocol (VIRTUAL) is holding around 20% monthly gains despite short-term market weakness.
-
The 4H chart shows a developing inverse head and shoulders pattern, a classic bullish reversal structure.
-
Price recently faced rejection near the $0.85 neckline, suggesting the right shoulder is still forming.
-
A potential dip toward the $0.78 support zone could complete the pattern and attract buyers.
-
A confirmed breakout above $0.85 may open the door for a stronger upside move, while losing $0.78 could delay the bullish setup.
Virtuals Protocol (VIRTUAL), the native token of the decentralized infrastructure and launchpad powering autonomous AI agents, has been holding up relatively well despite recent market-wide hesitation. The token is still sitting on around 20% monthly gains, although it is trading slightly in the red today in line with broader crypto sentiment.
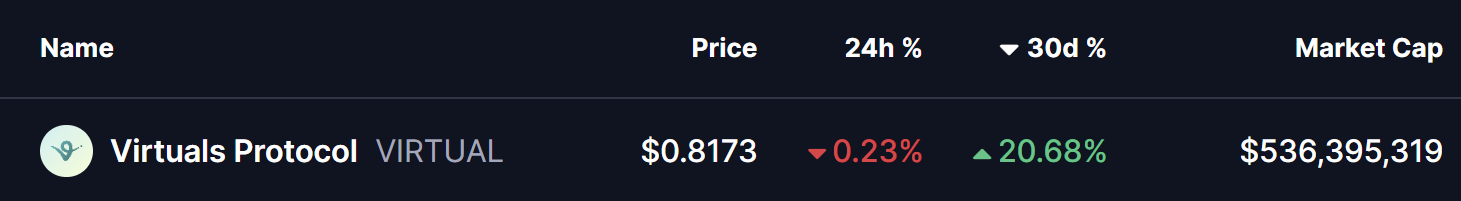
Source: Coinmarketcap
However, when you zoom into the chart, the price action tells a more interesting story. Beneath the short-term weakness, VIRTUAL appears to be building a classic bullish reversal structure, one that could act as the base for a stronger upside move if confirmed.
Inverse Head and Shoulders Pattern Takes Shape
On the 4-hour timeframe, VIRTUAL has carved out a clear inverse head and shoulders pattern, a formation often associated with trend reversals after a prolonged pullback.
-
The left shoulder developed near the $0.80 zone, where buyers initially stepped in.
-
This was followed by a deeper decline toward $0.75, forming the head of the structure and marking the local low.
-
Price then rebounded toward the descending neckline resistance around $0.85, where it faced rejection once again.
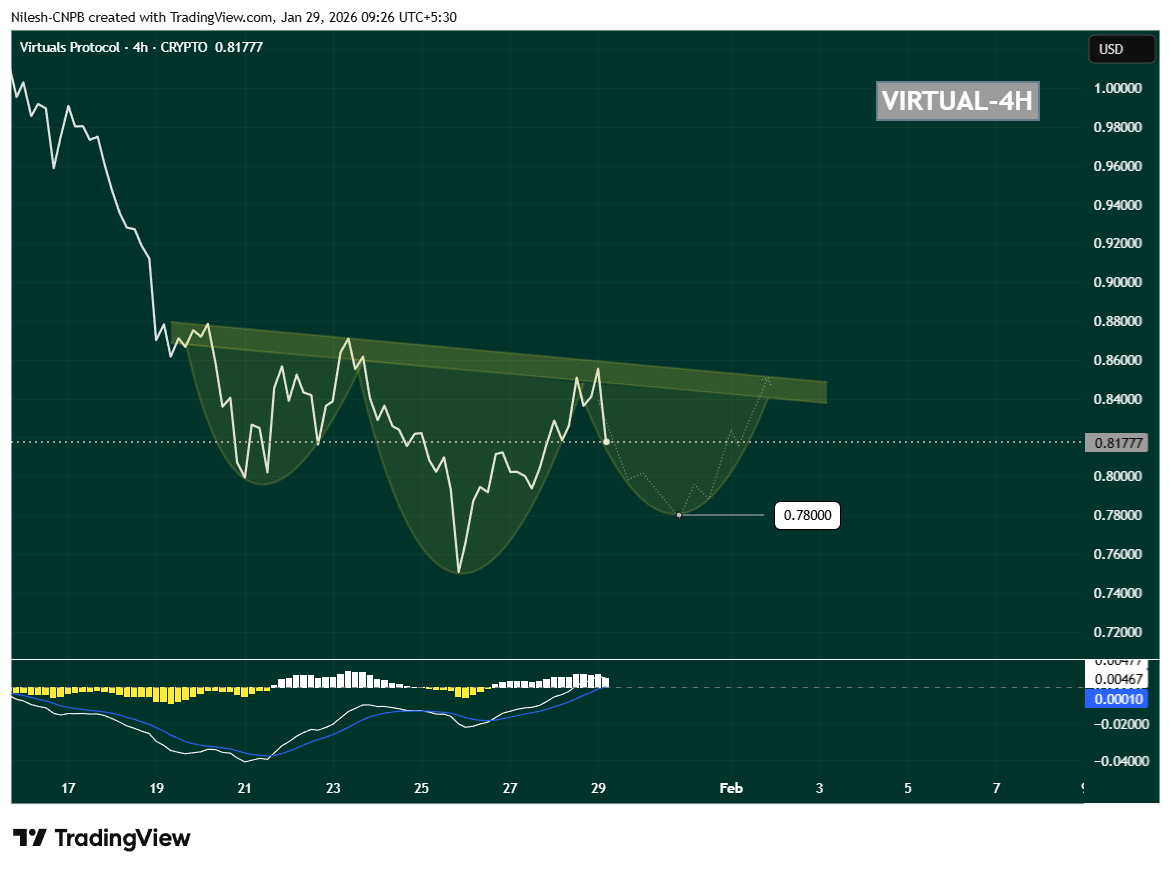
VIRTUAL 4H Chart/Coinsprobe (Source: Tradingview)
Following this rejection, VIRTUAL has started to drift lower and is currently trading near $0.8177, suggesting that the right shoulder may still be forming. This behavior fits well with the textbook structure of the pattern and keeps the bullish setup technically valid for now.
Momentum Signals Support the Setup
Momentum indicators are also worth watching closely. On the same timeframe, the MACD is cooling off and curling downward, reflecting short-term weakness rather than a full trend breakdown. In many cases, this kind of MACD reset during right-shoulder formation actually helps fuel the next impulsive move higher once buyers regain control.
As long as selling pressure remains controlled and price avoids a sharp breakdown, this momentum reset can work in favor of the bulls.
What’s Next for VIRTUAL?
If the pattern continues to play out, VIRTUAL could dip toward the $0.78 region, which aligns well with the projected right-shoulder bottom visible on the chart. This zone may act as a critical demand area where buyers look to step back in.
A strong bounce from this region, followed by renewed buying pressure, would increase the probability of a bullish breakout attempt toward the $0.85 neckline. A clean move above this resistance would confirm the inverse head and shoulders pattern and signal a potential shift back into a short-term uptrend.
On the downside, losing the $0.78 support decisively would weaken the structure and delay the bullish thesis, potentially opening the door for deeper consolidation.
For now, VIRTUAL is at a key technical crossroads. The structure remains constructive, the pattern is intact, and the chart suggests that the next major move—up or down—could arrive once this right shoulder finishes forming. Traders will be watching closely how price reacts around support in the coming sessions.
Disclaimer: The views and analysis presented in this article are for informational purposes only and reflect the author’s perspective, not financial advice. Technical patterns and indicators discussed are subject to market volatility and may or may not yield the anticipated results. Investors are advised to exercise caution, conduct independent research, and make decisions aligned with their individual risk tolerance.
About Author: Nilesh Hembade is the Founder and Lead Author of Coinsprobe, with over 5 years of experience in the cryptocurrency and blockchain industry. Since launching Coinsprobe in 2023, he has been providing daily, research-driven insights through in-depth market analysis, on-chain data, and technical research.
Disclaimer: The information on this page may come from third parties and does not represent the views or opinions of Gate. The content displayed on this page is for reference only and does not constitute any financial, investment, or legal advice. Gate does not guarantee the accuracy or completeness of the information and shall not be liable for any losses arising from the use of this information. Virtual asset investments carry high risks and are subject to significant price volatility. You may lose all of your invested principal. Please fully understand the relevant risks and make prudent decisions based on your own financial situation and risk tolerance. For details, please refer to
Disclaimer.
Related Articles
On-chain activity is exploding, but Ethereum can't seem to gain momentum? Experts reveal the "fatal weakness": could drop to $1,500
CryptoQuant reports indicate that Ethereum faces an "adoption paradox," where despite network activity reaching new highs, the token price has declined. If the bear market continues, Ether could potentially fall to $1,500 by the end of the third quarter. Smart contract activity has risen while decoupling from Ether's price, with exchange inflows being a better reflection of price dynamics. Weak investment demand and continuous capital outflows remain the primary concern.
区块客8m ago
Pi Network Lists on Major CEX, Price Surges 30% in a Month Before Pi Day
Pi Network has seen a recent trading price increase of approximately 10%, primarily driven by the upcoming listing of the PI token on a major U.S. centralized exchange and Pi Day, which has boosted retail investor confidence. Technical analysis shows a bullish outlook in the short term, though caution remains warranted for the medium to long term. Community sentiment has warmed, indicating renewed retail interest, which provides support for short-term upside potential.
MarketWhisper38m ago
Ripple Splurges $750 Million on Share Buyback While XRP Continues Declining: Why Is the Company's Strategy Diverging from Token Value?
Ripple announced a $750 million stock buyback, with its company valuation potentially rising to $50 billion, yet the XRP token price continues to decline, exposing a decoupling phenomenon between the company and the token. Market confidence in Ripple and XRP is gradually diverging, requiring investors to clarify whether they are investing in company strength or token value, as they face challenges from regulation, utility, and market patience.
PANews44m ago
XRP Today's News: Rare Bottom Signal Appears, Technical Analysis Suggests Price Reversal Approaching
According to Glassnode data, XRP exhibits two major indicator signals indicating that the price is below its fair value, and the realized profit/loss ratio is approaching 1.0, which historically suggests a possible rebound. Additionally, XRP is consolidating within a symmetrical triangle pattern, with a key resistance at $1.50 and support at $1.30, as the market is about to experience a breakout in a specific direction.
MarketWhisper52m ago
VIA Soars 23.45% in Minutes — Traders React to Whale Activity
VIA's price surged by 23.45% in five minutes, currently trading at $0.002026. The rise is linked to increased whale activity and broader market trends, prompting traders to monitor key resistance and support levels.
Coinfomania1h ago
CryptoQuant: Ethereum Adoption Paradox Deteriorates, Price May Fall to $1500
Ethereum faces an "adoption paradox," where network activity reaches record highs but ETH price has fallen sharply, showing a divergence between the two. Analysis points out that current network activity growth primarily comes from automated contracts like DeFi, rather than genuine user demand, which intensifies selling pressure. If the bear market continues into 2026, ETH could fall to $1,500. Attention should be paid to changes in capital inflows and exchange inflows to determine whether ETH will emerge from the bear market.
MarketWhisper1h ago