Key Takeaways
-
ASTER rebounds strongly, gaining nearly 10% as the broader crypto market recovers, with price holding above key support near $0.55.
-
Harmonic structure remains bullish in the short term, with the Bearish Shark pattern allowing upside continuation toward resistance.
-
A breakout above $0.687 (50-day MA) could open the path toward the $0.828 target, while failure to hold support may invalidate the setup.
The broader cryptocurrency market is showing signs of relief today after a sharp sell-off earlier this week. Bitcoin (BTC) briefly dipped to the $74,000 region before staging a rebound above $78,000, gaining nearly 3% on the day. Ethereum (ETH) has also followed suit, climbing around 4.4% in the past 24 hours.
Amid this recovery, several altcoins have turned green, including the decentralized exchange (DEX) token Aster (ASTER). The token has surged over 8%, trimming its monthly losses to around 21%. More importantly, ASTER’s price action is now flashing a familiar technical setup that hints at further upside potential.
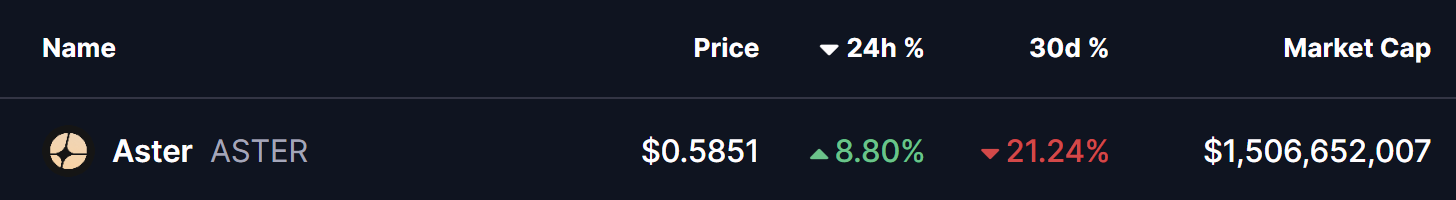
Source: Coinmarketcap
Technical Patterns Hint at Upside Momentum
From a technical perspective, ASTER’s daily chart reveals the formation of a Bearish Shark harmonic pattern, a widely tracked structure in harmonic trading. While the pattern is traditionally associated with a possible reversal once fully completed, it often allows for short-term bullish continuation as price advances toward the C-point.
As seen on the chart, the O-X-A-B structure has already been completed, with price finding support near the B-point around the $0.55 region. ASTER is currently trading near $0.584, showing early signs of stabilization after the recent sell-off.
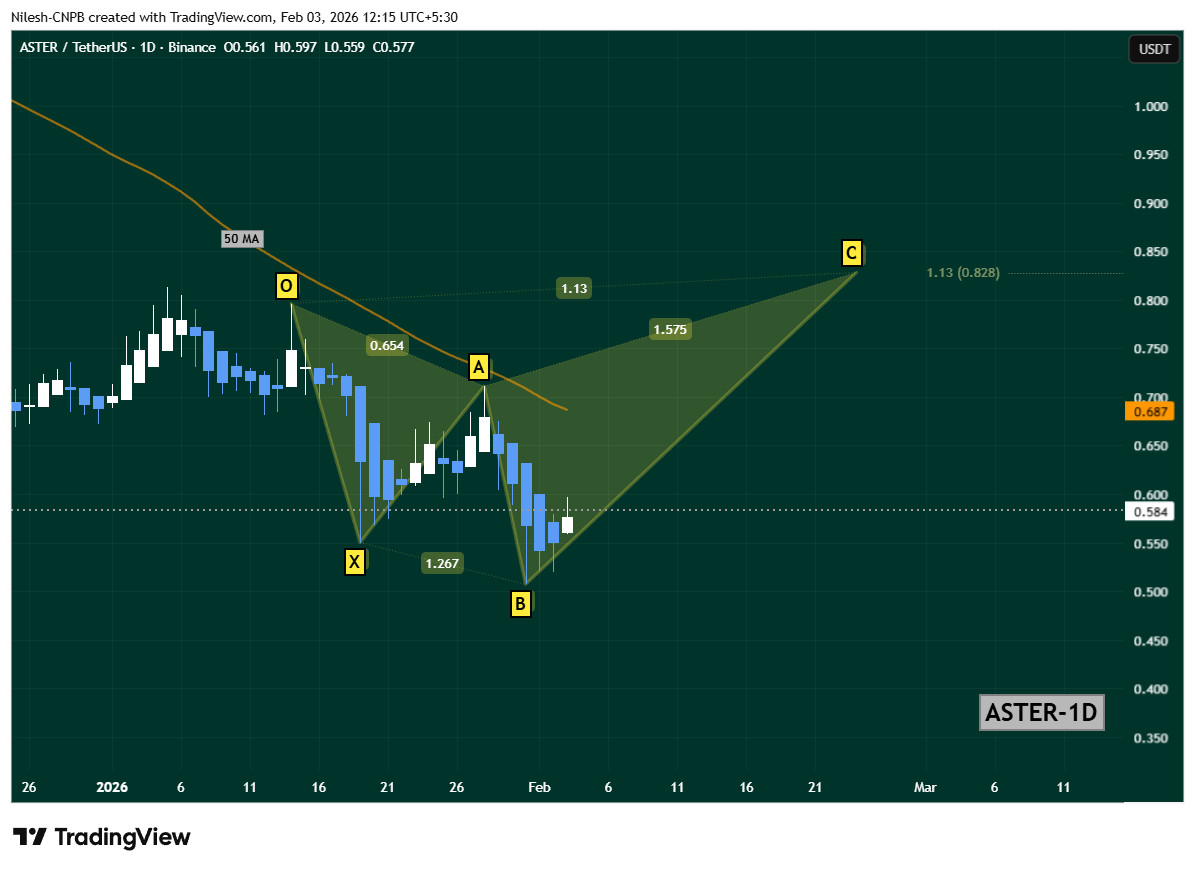
Aster (ASTER) Daily Chart/Coinsprobe (Source: Tradingview
The immediate hurdle for bulls remains the 50-day moving average, positioned around $0.687. This level has acted as a dynamic resistance in recent weeks, capping upside attempts and triggering pullbacks.
What’s Next for ASTER?
A decisive daily close above the 50-day MA ($0.687) would be a key technical signal, strengthening the short-term recovery narrative. Such a breakout could attract fresh momentum buyers and set the stage for a broader upside move.
If bullish momentum sustains, the harmonic projection points toward the C-point near $0.828, which aligns with the 1.13 Fibonacci extension of the Shark pattern. This level represents a potential upside target in the coming sessions, provided overall market sentiment remains supportive.
Despite the improving technical picture, downside risks have not disappeared. A failure to hold the B-point support zone could invalidate the bullish continuation scenario. In that case, ASTER may enter a period of extended consolidation or face renewed downside pressure before any meaningful recovery attempt.
Disclaimer: The views and analysis presented in this article are for informational purposes only and reflect the author’s perspective, not financial advice. Technical patterns and indicators discussed are subject to market volatility and may or may not yield the anticipated results. Investors are advised to exercise caution, conduct independent research, and make decisions aligned with their individual risk tolerance.
About Author: Nilesh Hembade is the Founder and Lead Author of Coinsprobe, with over 5 years of experience in the cryptocurrency and blockchain industry. Since launching Coinsprobe in 2023, he has been providing daily, research-driven insights through in-depth market analysis, on-chain data, and technical research.
Disclaimer: The information on this page may come from third parties and does not represent the views or opinions of Gate. The content displayed on this page is for reference only and does not constitute any financial, investment, or legal advice. Gate does not guarantee the accuracy or completeness of the information and shall not be liable for any losses arising from the use of this information. Virtual asset investments carry high risks and are subject to significant price volatility. You may lose all of your invested principal. Please fully understand the relevant risks and make prudent decisions based on your own financial situation and risk tolerance. For details, please refer to
Disclaimer.
Related Articles
HOT Climbs to $0.0004141, Its Falling Wedge Breakout Sets to Push Price 300% Higher: Analyst
The Holo (HOT) coin is showing bullish signals, with analysts predicting a significant price increase due to a breakout from a falling wedge pattern. Recent trends indicate rising interest and market activity, positioning HOT for potential gains soon.
BlockChainReporter7m ago
Bitcoin Cash Battles $459 Resistance as Massive Sell Walls Stack Toward $650
BCH is trading at $455.86 close to the resistance range of $459.20 with the support level of $447.44.
The chart data indicates that the chart has strong resistance levels at around $520, $580 and $650 which restricts the momentum on short term upside.
Following a sharp fall, price
CryptoNewsLand40m ago
HYPE Hits $35.53 After 2.4% Jump — Will Momentum Hold as Price Tests $35.59 Resistance?
Hyperliquid’s HYPE trades at $35.53, approaching the $35.59 resistance after a 2.4% daily gain.
The chart shows the $33.67 zone acting as support after price moved above a previously contested level.
Price now trades between $33.67 support and $35.59 resistance, shaping the immediate
CryptoNewsLand1h ago
Is Injective (INJ) a Dead Coin or the Next 2800% Opportunity? Here’s What The Chart Is Saying
The Injective price has fallen sharply from its previous all-time high, leading some traders to question whether the project has lost its momentum.
However, a recent technical analysis shared by top analyst Crypto Patel suggests that the recent decline may actually represent a typical
CaptainAltcoin2h ago
CFX 4-hour chart reaches a new high for the phase, with approximately 14% increase over 24 hours
Gate News: On March 15, market data shows that CFX reached a new phase high on the 4-hour K-line chart, with prices touching approximately 0.06282 USDT at their peak, representing a 24-hour gain of around 14%. Some community members believe this rally may be related to recent macroeconomic catalysts. Earlier, media outlets citing sources reported that Iran is considering allowing certain tankers to pass through the Strait of Hormuz on the condition that petroleum transport be settled in Chinese yuan. Related discussions have once again sparked market attention toward yuan stablecoins and cross-border payment narratives.
GateNews3h ago
After the network upgrade: What prospects await SOL?
The official approval of protocol SIMD-0266 aims to optimize computing efficiency on the Solana network by introducing p-tokens, simplifying transaction processing. This upgrade, set for April, has prompted increased buying activity and could lead to significant cost reductions and performance improvements.
TapChiBitcoin4h ago