
Key Takeaways
-
Ethereum ($ETH) has broken below the critical $2,637 support, signaling a shift in short-term market structure.
-
Price is now trading near $2,400, posting an 11.10% daily loss and a 18% year-to-date decline.
-
The current price action mirrors a bearish fractal from August 2024, raising the risk of further downside.
-
If selling pressure persists, ETH could slide toward the $2,128 support zone, where buyers may attempt a defense.
Ethereum ($ETH), the second-largest cryptocurrency by market capitalization, is once again under heavy selling pressure. As of January 31, 2026, ETH has slipped near the $2,400 mark, printing an 11.10% decline in the last 24 hours and extending its year-to-date losses to 18.73%, while also marking a fresh yearly low.
The sharp move lower has shifted short-term sentiment firmly in favor of the bears, with both price structure and derivatives data flashing warning signs.
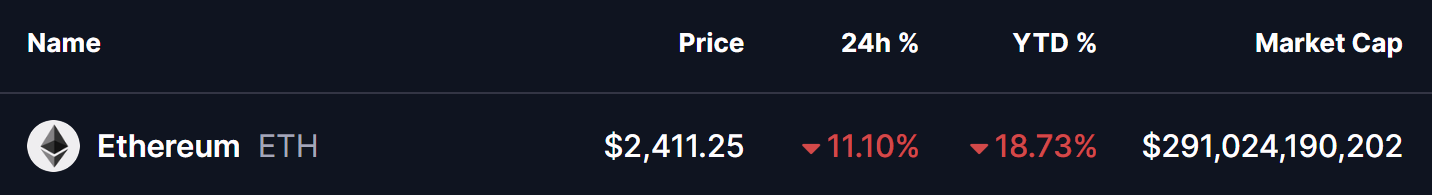
Source: Coinmarketcap
Liquidations Soar as Bulls Get Trapped
The downside move has been amplified by aggressive liquidations across the derivatives market. Recent data shows over $553 million worth of ETH positions liquidated, with a striking $523 million coming from long positions, compared to just $30 million in shorts over the past 24 hours.
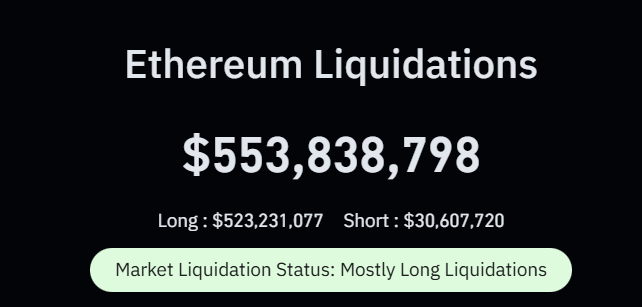
Ethereum (ETH) Liquidations/Source: Coinglass
This imbalance highlights a classic scenario of over-leveraged bulls getting flushed out, where forced sell orders accelerate downside momentum. When liquidations skew this heavily toward longs, price often struggles to find immediate relief, as dip buyers hesitate and momentum traders press their advantage.
Bears Take Control on the Daily Chart
From a technical perspective, Ethereum’s daily chart paints a concerning picture. ETH has decisively lost the $2,637 horizontal support, a level that previously acted as a floor during consolidation. Once this zone gave way, selling pressure intensified, dragging price swiftly toward the $2,400 region.
What makes this move particularly notable is its resemblance to a previous downside fractal visible on the chart. Back in August 2024, ETH broke a similar support structure, triggering a sharp continuation move that ultimately drove price into a deeper corrective phase before buyers finally stepped in.
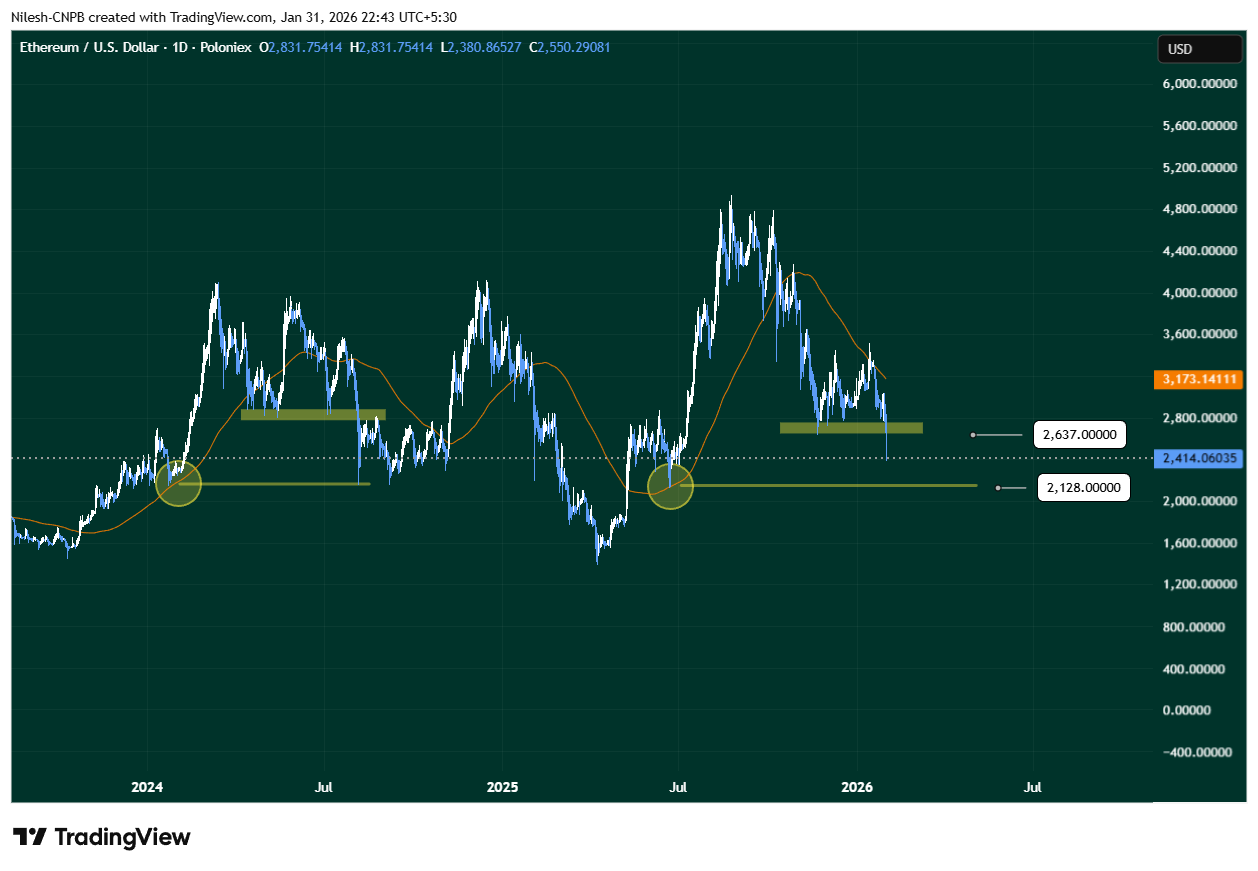
Ethereum (ETH) Daily Chart/Coinsprobe (Source: Tradingview)
The current structure appears to be echoing that same behavior—support break, rapid downside expansion, and limited bounce attempts so far.
More Pain Ahead?
If this historical fractal continues to play out, Ethereum could be heading toward its next major support near $2,128, a zone that previously attracted strong demand. This level stands out as a potential area where longer-term buyers may begin to show interest, especially if broader market conditions stabilize.
On a flip side, a strong reclaim of the $2,637 resistance zone, followed by acceptance above it, would invalidate the current fractal setup and suggest that today’s breakdown was a false move. Such a recovery would likely force late shorts to cover and could stabilize price action.
For now, however, Ethereum remains vulnerable. With heavy long liquidations, broken support, and a familiar bearish pattern resurfacing on the chart, the path of least resistance appears tilted to the downside—at least in the short term.
Disclaimer: The views and analysis presented in this article are for informational purposes only and reflect the author’s perspective, not financial advice. Technical patterns and indicators discussed are subject to market volatility and may or may not yield the anticipated results. Investors are advised to exercise caution, conduct independent research, and make decisions aligned with their individual risk tolerance.
About Author: Nilesh Hembade is the Founder and Lead Author of Coinsprobe, with over 5 years of experience in the cryptocurrency and blockchain industry. Since launching Coinsprobe in 2023, he has been providing daily, research-driven insights through in-depth market analysis, on-chain data, and technical research.
Disclaimer: The information on this page may come from third parties and does not represent the views or opinions of Gate. The content displayed on this page is for reference only and does not constitute any financial, investment, or legal advice. Gate does not guarantee the accuracy or completeness of the information and shall not be liable for any losses arising from the use of this information. Virtual asset investments carry high risks and are subject to significant price volatility. You may lose all of your invested principal. Please fully understand the relevant risks and make prudent decisions based on your own financial situation and risk tolerance. For details, please refer to
Disclaimer.
Related Articles
Cumberland 关联钱包过去 2 小时从某 CEX 提取 2.3 万枚 ETH
Gate News 消息,3 月 13 日,据 Lookonchain 监测,过去两小时内,与做市机构 Cumberland 关联的钱包合计从某 CEX 提现 23,000 枚 ETH,按市价约合 5,010 万美元。
GateNews1h ago
过去 24 小时全网爆仓 3.9 亿美元,空单爆仓占比超 80%
根据CoinGlass数据,3月13日加密货币市场在过去24小时内爆仓金额达3.90亿美元,99,099人被爆仓,BTC和ETH分别爆仓1.68亿和1.18亿美元,最大单笔爆仓是SOLUSDT交易对,价值400.33万美元。
GateNews1h ago
Whale 0x2d85 Returns to Market, Purchases 5,003 ETH After Six-Month Hiatus
Gate News bot message, Whale address 0x2d85, who previously sold ETH at approximately $4,300 six months ago, has re-entered the market after six months of inactivity. The whale purchased 5,003 ETH at $2,179, totaling $10.9 million in transaction value.
GateNews2h ago
ETH drops below 2150 USDT
Gate News bot message: Gate market data shows ETH has broken below 2150 USDT, current price is 2149.78 USDT.
CryptoRadar2h ago
March 13 Crypto ETF Flow Report: Bitcoin and Ethereum See Positive Inflows
Gate News bot message, According to the March 13 update, Bitcoin ETFs recorded a 1-day net inflow of +570 BTC (+$41.87M) and a 7-day net inflow of +2,589 BTC (+$190.04M). Ethereum ETFs showed a 1-day net inflow of +44,240 ETH (+$96.71M) and a 7-day net inflow of +1,540 ETH (+$3.37M). Solana ETFs reg
GateNews2h ago
ETH 15分钟下跌1.01%:链上大额转账与杠杆清算共振引发抛售
2026年3月13日14:30至14:45(UTC),ETH在15分钟内收益率下跌-1.01%,价格区间为2172.1至2201.5 USDT,振幅达到1.34%。此次下跌发生在整体市场波动加剧、关注度大幅提升的背景下,表现出短线抛压主导的市场特征。
本次异动的主要驱动力来自链上资金转移与杠杆清算。该时段内,链上共计超100,000 ETH(约2.43亿美元)流入中心化交易所,成为明显的抛售信号
GateNews2h ago