
Key Takeaways
-
SUI has dropped nearly 67% from its recent peak, placing it in a potential bottoming zone.
-
Current price action closely mirrors Solana’s 2025 bottoming fractal, which preceded a strong reversal.
-
A reclaim of the 50-day moving average could confirm a trend shift and open the door for a broader recovery.
SUI, the native token of Sui’s Layer-1 blockchain, has struggled to live up to its early hype in recent months, especially when compared to** Solana’s (SOL)** 2021 explosive performance. A broader market correction has only added pressure, dragging SUI nearly 50% lower over the past 90 days.
But zooming out and looking beneath the surface, the current price structure tells a more interesting story. On the charts, SUI is starting to resemble a bottoming fractal previously seen in Solana—a setup that eventually led to a sharp and sustained upside move.
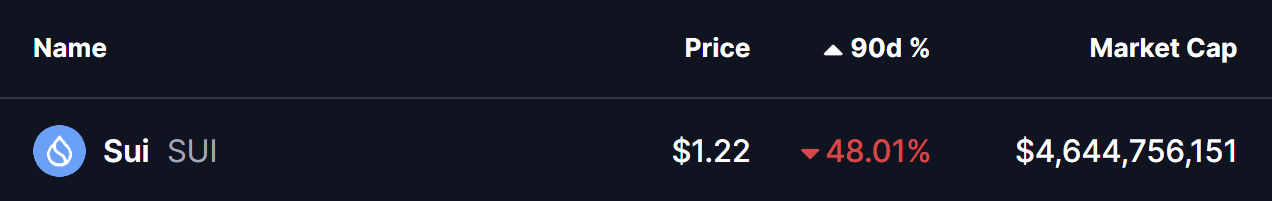
Source: Coinmarketcap
SUI Mirrors SOL’s Bottoming Path
A side-by-side comparison of SUI and SOL reveals striking similarities.
Back in early 2025, **Solana **topped near $295 before entering a sharp corrective phase. Price slipped below the 50-day moving average, signaling weakening momentum. The sell-off eventually stretched into a deep 67% drawdown, flushing out late longs and marking a clear sentiment reset.
That low proved pivotal.
Once SOL reclaimed its 50-day moving average, the trend structure flipped. What followed was a 163% rally, one of the most notable reversals of 2025.
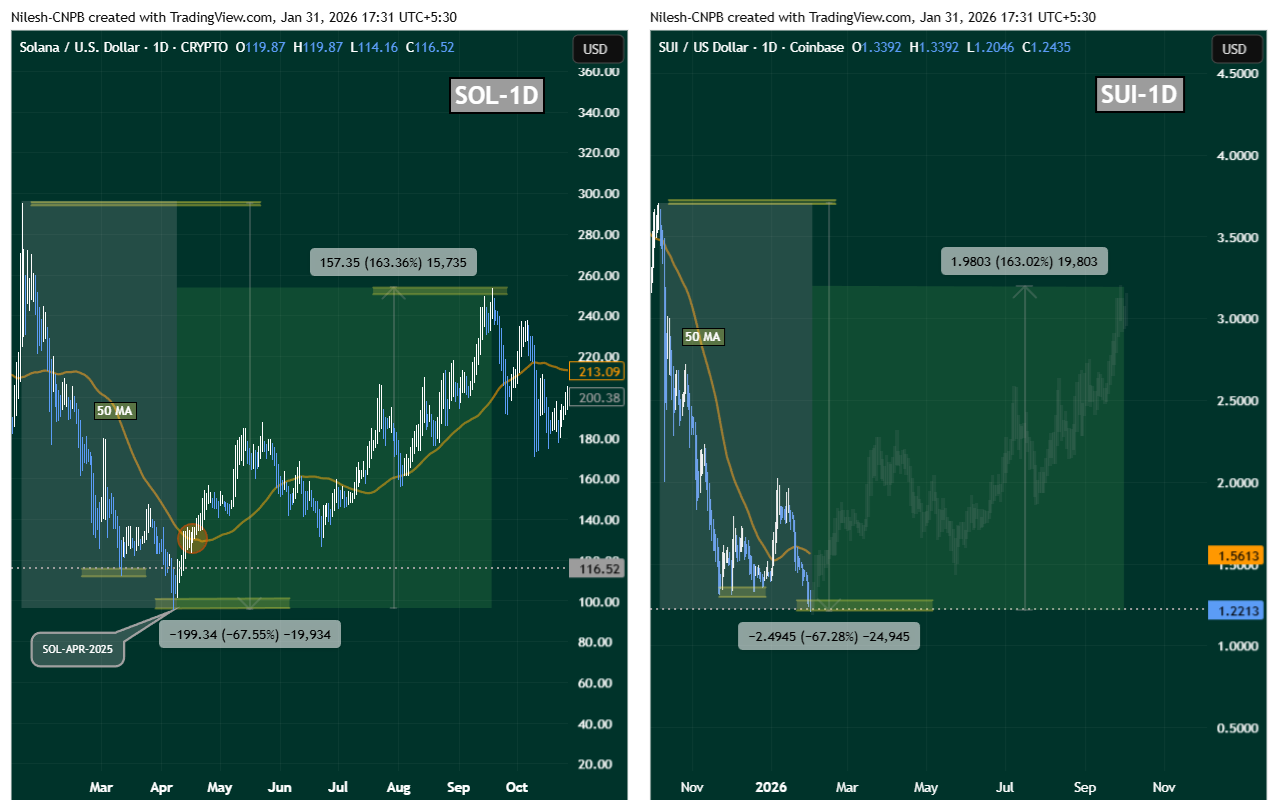
SOL and SUI Fractal Chart/Coinsprobe (Source: Tradingview)
SUI now appears to be following a similar script.
After peaking around $3.70 in October 2025, SUI entered a steep correction, losing its 50-day moving average and sliding into a nearly identical 67% drawdown. Momentum faded, volatility compressed, and price action began to flatten—classic characteristics of a market searching for a base.
What’s Next for SUI?
From a technical perspective, SUI is now sitting near a critical inflection zone around $1.20–$1.22, an area that could act as a potential bottom if buyers continue to defend it.
The first major confirmation bulls will want to see is a reclaim of the 50-day moving average, currently hovering near $1.56. A sustained move above this level would signal that bearish momentum is fading and that buyers are regaining control.
If that reclaim occurs, SUI could transition into a broader recovery phase. In a scenario where the SOL fractal continues to play out, upside expansion toward the $3.00–$3.20 region would come back into focus over the medium term.
Key Risk Note
While fractal comparisons can offer valuable context, they are not guarantees. Each asset trades within its own liquidity environment, sentiment cycle, and macro backdrop. For SUI, confirmation still matters—especially through moving average reclaims and consistent follow-through buying.
Until then, the structure suggests risk is compressing, not expanding.
Disclaimer: The views and analysis presented in this article are for informational purposes only and reflect the author’s perspective, not financial advice. Technical patterns and indicators discussed are subject to market volatility and may or may not yield the anticipated results. Investors are advised to exercise caution, conduct independent research, and make decisions aligned with their individual risk tolerance.
About Author: Nilesh Hembade is the Founder and Lead Author of Coinsprobe, with over 5 years of experience in the cryptocurrency and blockchain industry. Since launching Coinsprobe in 2023, he has been providing daily, research-driven insights through in-depth market analysis, on-chain data, and technical research.
Disclaimer: The information on this page may come from third parties and does not represent the views or opinions of Gate. The content displayed on this page is for reference only and does not constitute any financial, investment, or legal advice. Gate does not guarantee the accuracy or completeness of the information and shall not be liable for any losses arising from the use of this information. Virtual asset investments carry high risks and are subject to significant price volatility. You may lose all of your invested principal. Please fully understand the relevant risks and make prudent decisions based on your own financial situation and risk tolerance. For details, please refer to
Disclaimer.
Related Articles
Chainlink (LINK) Price Prediction: What Comes Next After the Wave 5 Decline
Chainlink seems to have found a familiar groove. It has been moving sideways after the fall from the February highs of $12.50. Both bulls and bears are waiting for a clear trend in the cryptocurrency. The daily chop hides a more structured picture beneath the surface, one that technical
CaptainAltcoin21m ago
Arthur Hayes Bold Bitcoin Statement As Gold and Nasdaq-100 Slip
Since the Middle East conflict began on February 28, longtime crypto observer Arthur Hayes noted on social media that Bitcoin has quietly outperformed traditional safe havens and major tech benchmarks. Hayes pointed to a roughly 7 percent gain in Bitcoin since the strikes began, compared with a 2 pe
BlockChainReporter1h ago
PEPE Price at $0.053259 as Tight Range and Falling Volume Shape Short-Term Market Activity
PEPE was traded at $0.053259 and has recorded a 3.0 percent fall in value but it is within a thin band of support and resistance.
The market exhibited a volume of 235.15M in 24 hour trading, which is a decline of 19.16% reflecting less trading activity.
Technical indicators are not
CryptoNewsLand3h ago
Aave Price Holds Near $111 After $27M Liquidation Error Shakes DeFi
Key Insights
Aave traded near $111 after a CAPO oracle configuration error triggered $27 million in liquidations across 34 wstETH-backed accounts.
Trading activity cooled as derivatives volume dropped and open interest declined, signaling that traders stepped back following the liquidation in
CryptoFrontNews4h ago
XRP Holds $1.34 Support While Leverage Heatmap Highlights $1.30 Risk Zone
XRP is trading at $1.36 in a tight range of support at $1.34 and resistance at $1.37.
The heatmap data indicates that there is a huge amount of long positions in the range of $1.30.
Should prices fall to around $1.30, long positions with high leverage in this region might
CryptoNewsLand4h ago
Crypto Market Update – River and Hyperliquid Lead Gainers As Decentralized Infrastructure Gains M...
The crypto market is displaying its typical volatility once again, yet under the noise of price movements, the beginnings of a narrative are starting to take shape. As of today, the “Top Gainers” on CoinMarketCap leans heavily towards projects targeting decentralized infrastructure and fast Layer-1s
BlockChainReporter5h ago