Goldman Sachs warns that in the coming weeks, Commodity Trading Advisor (CTA) funds may sell off up to $80 billion worth of stocks, potentially triggering systemic risk. The bank’s trading division states that CTA funds have issued a sell signal on the S&P 500, which could lead to a liquidation of approximately $33 billion within a week. Deteriorating liquidity conditions and increased short gamma positions are amplifying volatility risks, threatening spillover effects on macro-sensitive assets such as Bitcoin, gold, and silver.
Goldman Sachs Warns CTA Funds Could Liquidate $33 Billion in One Week
According to Goldman Sachs’ trading division, trend-following funds known as Commodity Trading Advisors (CTAs) have signaled a sell on the S&P 500 index. Goldman analysts explicitly state in their latest research report that, regardless of whether the market stabilizes or continues to decline in the short term, these systemic funds are expected to remain net sellers in the near future. This mechanical selling based on algorithms and technical indicators could serve as a catalyst for broader market adjustments.
Goldman estimates that if the market weakens further, these funds could sell approximately $33 billion worth of stocks within a week. This figure alone is sufficient to cause significant market impact, as CTA selling often triggers follow-on selling from other quant funds and risk management systems. More importantly, Goldman’s models indicate that if the S&P 500 continues to fall or breaches key technical levels, an additional systemic sell-off of up to $80 billion could be triggered within the next month.
The operation mechanism of CTA funds makes them amplifiers of market volatility. These funds trade based on momentum and trend indicators, increasing long positions during rallies and reducing or adding short positions during declines. This pro-cyclical behavior drives prices higher in bull markets but accelerates declines in bear markets. Currently, the S&P 500 has broken below several important moving averages, triggering sell signals in CTA models.
Goldman’s $80 billion sell-off forecast is based on multiple scenario analyses. If the market stabilizes and rebounds above critical technical support levels, the scale of liquidation could be limited to between $33 billion and $50 billion. However, if the market continues downward, breaking more support levels, the total sell-off could reach or even exceed the $80 billion upper estimate. This uncertainty itself increases market nervousness.
What’s more concerning is that Goldman emphasizes that other systemic strategies—including risk parity funds and volatility targeting funds—may also reduce their exposure if volatility remains elevated. This suggests that selling pressure may not be limited to CTAs alone. Risk parity funds adjust their positions based on asset volatility, decreasing leverage as volatility rises. Volatility targeting funds directly adjust their leverage according to volatility levels, systematically deleveraging when volatility spikes.
Short Gamma Effect Heightens Market Volatility Risks
Market conditions are already fragile, and Goldman analysts point out that deteriorating liquidity and changes in options positioning could further intensify price swings. When traders hold short gamma positions, they are often forced to sell in declining markets and buy in rising markets, which exacerbates volatility and accelerates intraday swings.
Gamma is the second derivative of options, measuring how the underlying asset’s price movements affect Delta (the first derivative). Market makers and options sellers typically hold short gamma positions, meaning that when the market declines, their Delta becomes more negative, forcing them to sell more stocks or futures to hedge. Conversely, when the market rises, their Delta becomes more positive, prompting buybacks. This mechanical hedging amplifies unidirectional market moves.
Market Impact of Short Gamma Positions
Downward acceleration: A 1% decline may require additional selling that amplifies to 1.5%
Upward resistance: Rebounds trigger mechanical buy pressure, often weaker
Volatility spike: Dual-sided amplification leads to intense intraday swings
Liquidity drying up: Large hedging orders squeeze market depth, widening slippage
Chain reactions: Triggering stop-losses and deleveraging in other risk management systems
Goldman notes that current short gamma positions are concentrated near key price levels. If the S&P 500 breaks below these levels, it could trigger large-scale mechanical selling, creating a “Gamma Squeeze” reversal. This scenario occurred during the March 2020 market crash, where forced hedging of short gamma positions exacerbated a single-day plunge.
Liquidity deterioration further magnifies these risks. In a liquid market, large hedging orders can be absorbed without significant price impact. When liquidity dries up, similar-sized sell orders can cause sharp price declines. Goldman’s liquidity indicators show widening bid-ask spreads and decreasing order book depth, signaling deteriorating liquidity.
Retail Fatigue Emerges, Goldman’s Panic Index Near Extremes
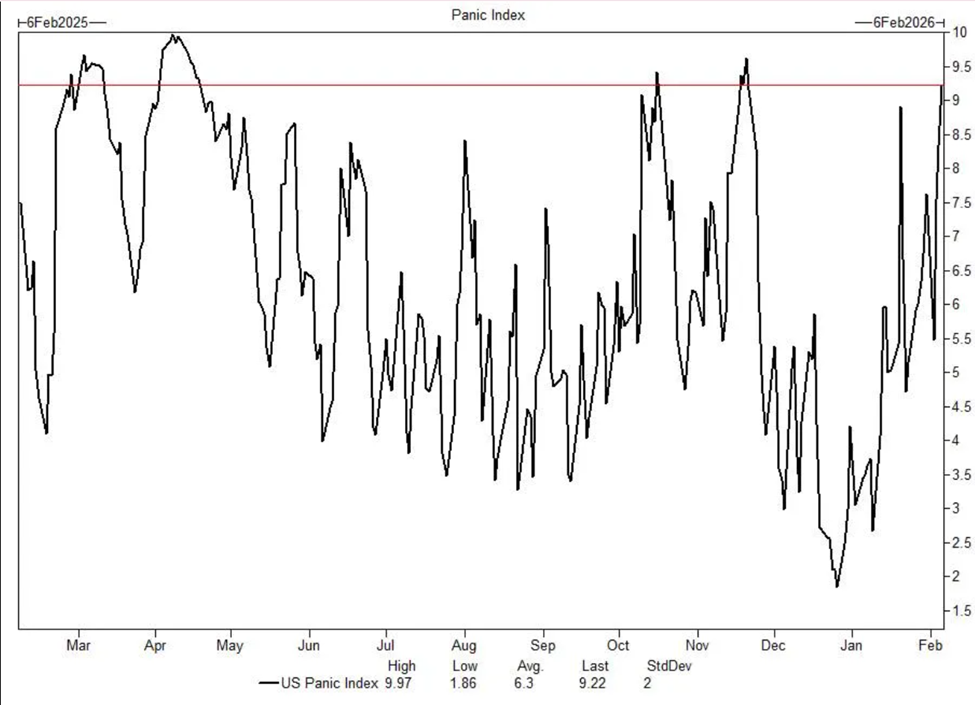
(Source: Goldman Sachs)
Investor sentiment is also showing signs of stress. Goldman’s internal Panic Index has recently approached levels associated with extreme nervousness. This index combines measures such as volatility term structure, options skew, market breadth, and other technical indicators to quantify market panic. When the index nears historical highs, it often signals a highly fragile market.
Meanwhile, retail investors, after a year of buying the dip, are beginning to show fatigue. Recent fund flows indicate retail investors are turning net sellers rather than buyers. This shift is significant because retail buying during dips has historically provided support to markets over the past year. When this support diminishes, markets may become more prone to rapid declines.
Goldman’s data shows that funds flowing into stocks via retail brokerages have fallen from weekly highs of tens of billions of dollars to near zero or negative territory. This change not only reflects waning retail confidence but also signifies the loss of an important marginal buyer. In an environment where institutional investors are forced to sell due to risk management requirements, retail withdrawal could worsen supply-demand imbalances.
The deterioration of retail sentiment is also evident in social media and online forums, where discussions are increasingly filled with confusion about market direction and fears of further declines. This emotional shift often precedes broader market corrections, as retail investors are typically the last to enter and the first to lose confidence.
Bitcoin and Precious Metals Face Spillover Risks
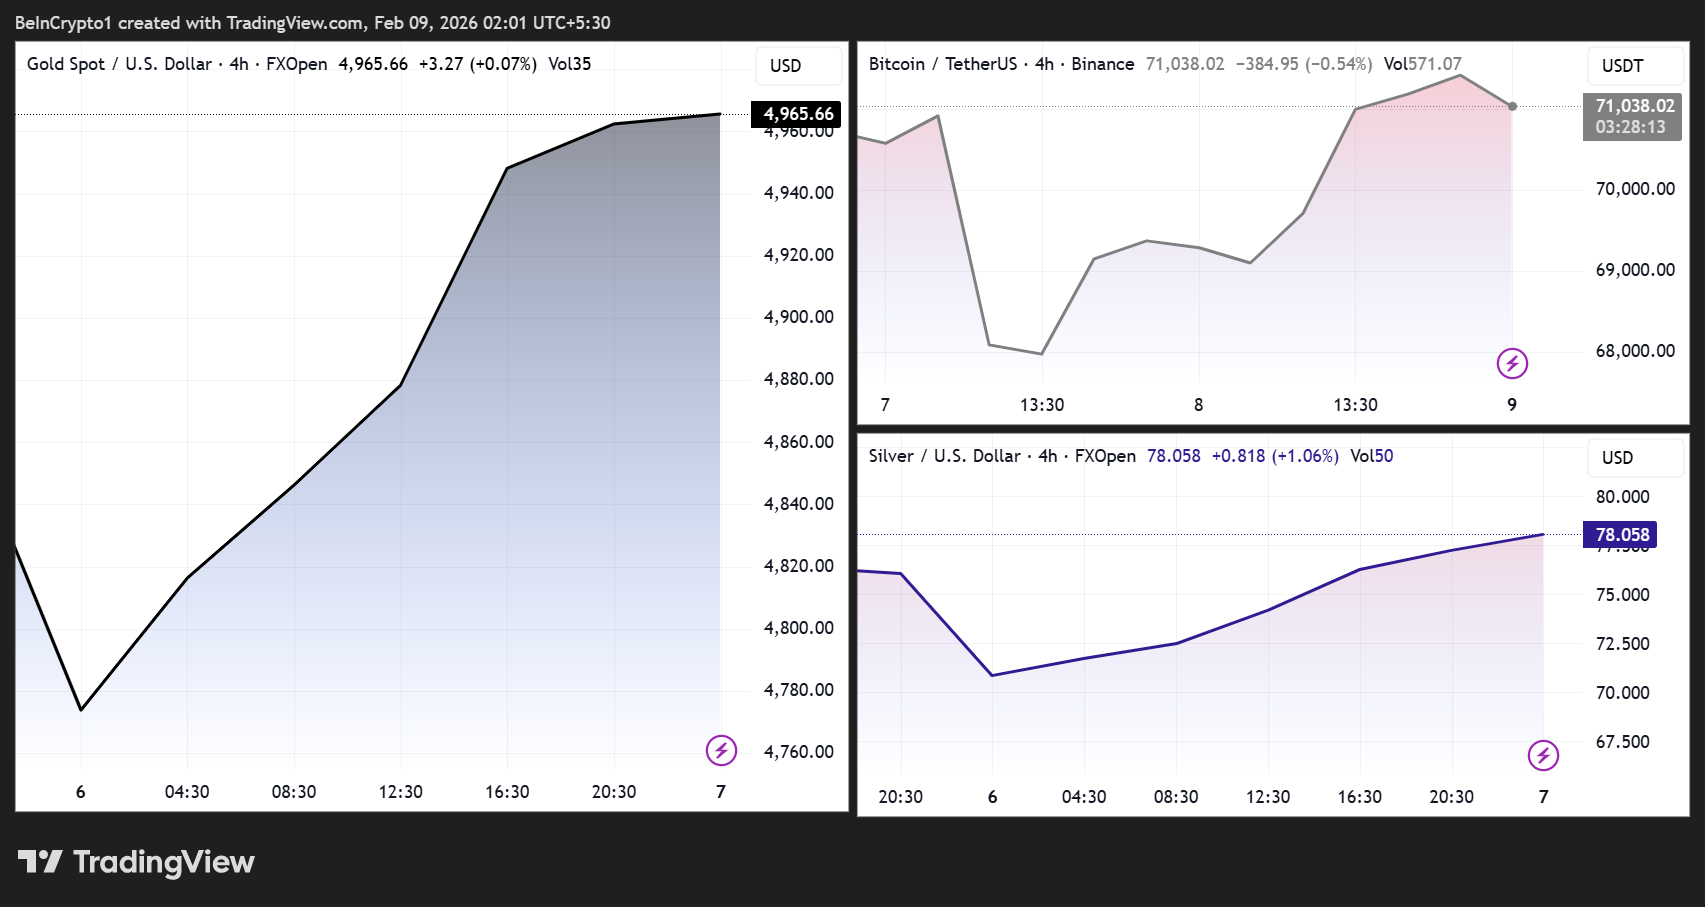
(Source: TradingView)
While Goldman’s analysis mainly focuses on equities, its implications extend beyond. Historically, large-scale, fund-driven equity sell-offs and liquidity crunches have heightened volatility in macro-sensitive assets, including cryptocurrencies.
In periods of liquidity stress, Bitcoin’s price movements increasingly correlate with overall risk sentiment. If forced equity liquidations accelerate, Bitcoin could face heightened volatility. The 2022 experience shows that when systemic funds unwind leverage on a large scale, Bitcoin often declines alongside stocks rather than acting as a safe haven. This correlation becomes especially pronounced during liquidity crises.
Crypto-related stocks and speculative assets favored by retail investors have already shown sensitivity to recent market swings, indicating that positions remain fragile. Stocks like Coinbase, MicroStrategy, and other crypto-linked equities tend to be more volatile than Bitcoin itself, often leading the downside during sell-offs. If these stocks trigger stop-losses or margin calls, they could spark chain reactions in the crypto markets.
At the same time, stock market volatility can trigger complex cross-asset flows. While risk aversion may pressure commodities, gold and silver—precious metals—can attract safe-haven demand during periods of heightened uncertainty, leading to sharp price swings driven by overall liquidity trends and dollar strength.
Gold faces a tug-of-war: on one side, panic-driven safe-haven buying; on the other, forced liquidations by institutional investors needing cash for margin calls or redemptions, which can cause asset sales including gold. During the March 2020 crash, gold temporarily plunged sharply due to liquidity crises forcing investors to sell what they could, not what they wanted.
Silver’s situation is more complex, as it is both a precious and industrial metal. Stock declines often signal economic slowdown, reducing industrial demand and pressuring silver prices. However, silver’s safe-haven properties can also come into play during extreme panic. This dual nature makes silver more volatile during market turbulence.
Liquidity Tightening Is a Key Variable, Seasonal Weakness Approaching
Liquidity remains a critical factor. As systemic funds deleverage, volatility rises, and seasonal market softness approaches, the coming weeks could see continued instability. If Goldman’s forecasts come true, the next month may test equities and spill over into Bitcoin and precious metals.
Seasonality also plays a role. Historical data shows that February and March tend to be relatively weak months for stocks, especially after strong early-year gains. The current fragile state of markets, combined with seasonal softness, could be the last straw. Additionally, March is typically a key earnings season; disappointing earnings or guidance could trigger broader sell-offs.
Goldman’s warnings are echoed by other major Wall Street firms and hedge fund managers. Morgan Stanley, JPMorgan, and Bank of America strategists have recently highlighted market fragility and potential correction risks. When multiple top-tier banks issue warnings simultaneously, markets tend to take notice.
For investors, Goldman’s $80 billion sell-off alert underscores the importance of risk management. Staying flexible, controlling leverage, maintaining ample cash, and preparing for volatility are crucial. History shows that systemic sell-offs often create long-term buying opportunities, but only disciplined, liquidity-conscious investors can capitalize on these moments.