On February 26, on-chain data shows that despite a temporary weakening in Cardano’s price, large wallet addresses continue to accumulate ADA. Data analytics firm Santiment revealed that the “Supply Distribution” indicator indicates that wallets holding between 100,000 and 100 million ADA (commonly referred to as sharks and whales) have significantly increased their holdings over the past few months, boosting their market influence.
Specifically, over the past six months, this core group of investors has accumulated approximately 819.4 million ADA, worth about $248 million at current valuations, increasing their share of circulating supply from 66.84% to 68.44%. This change suggests that large investors are continuing to accumulate during price dips rather than selling off, indicating a sustained medium- to long-term investment outlook.
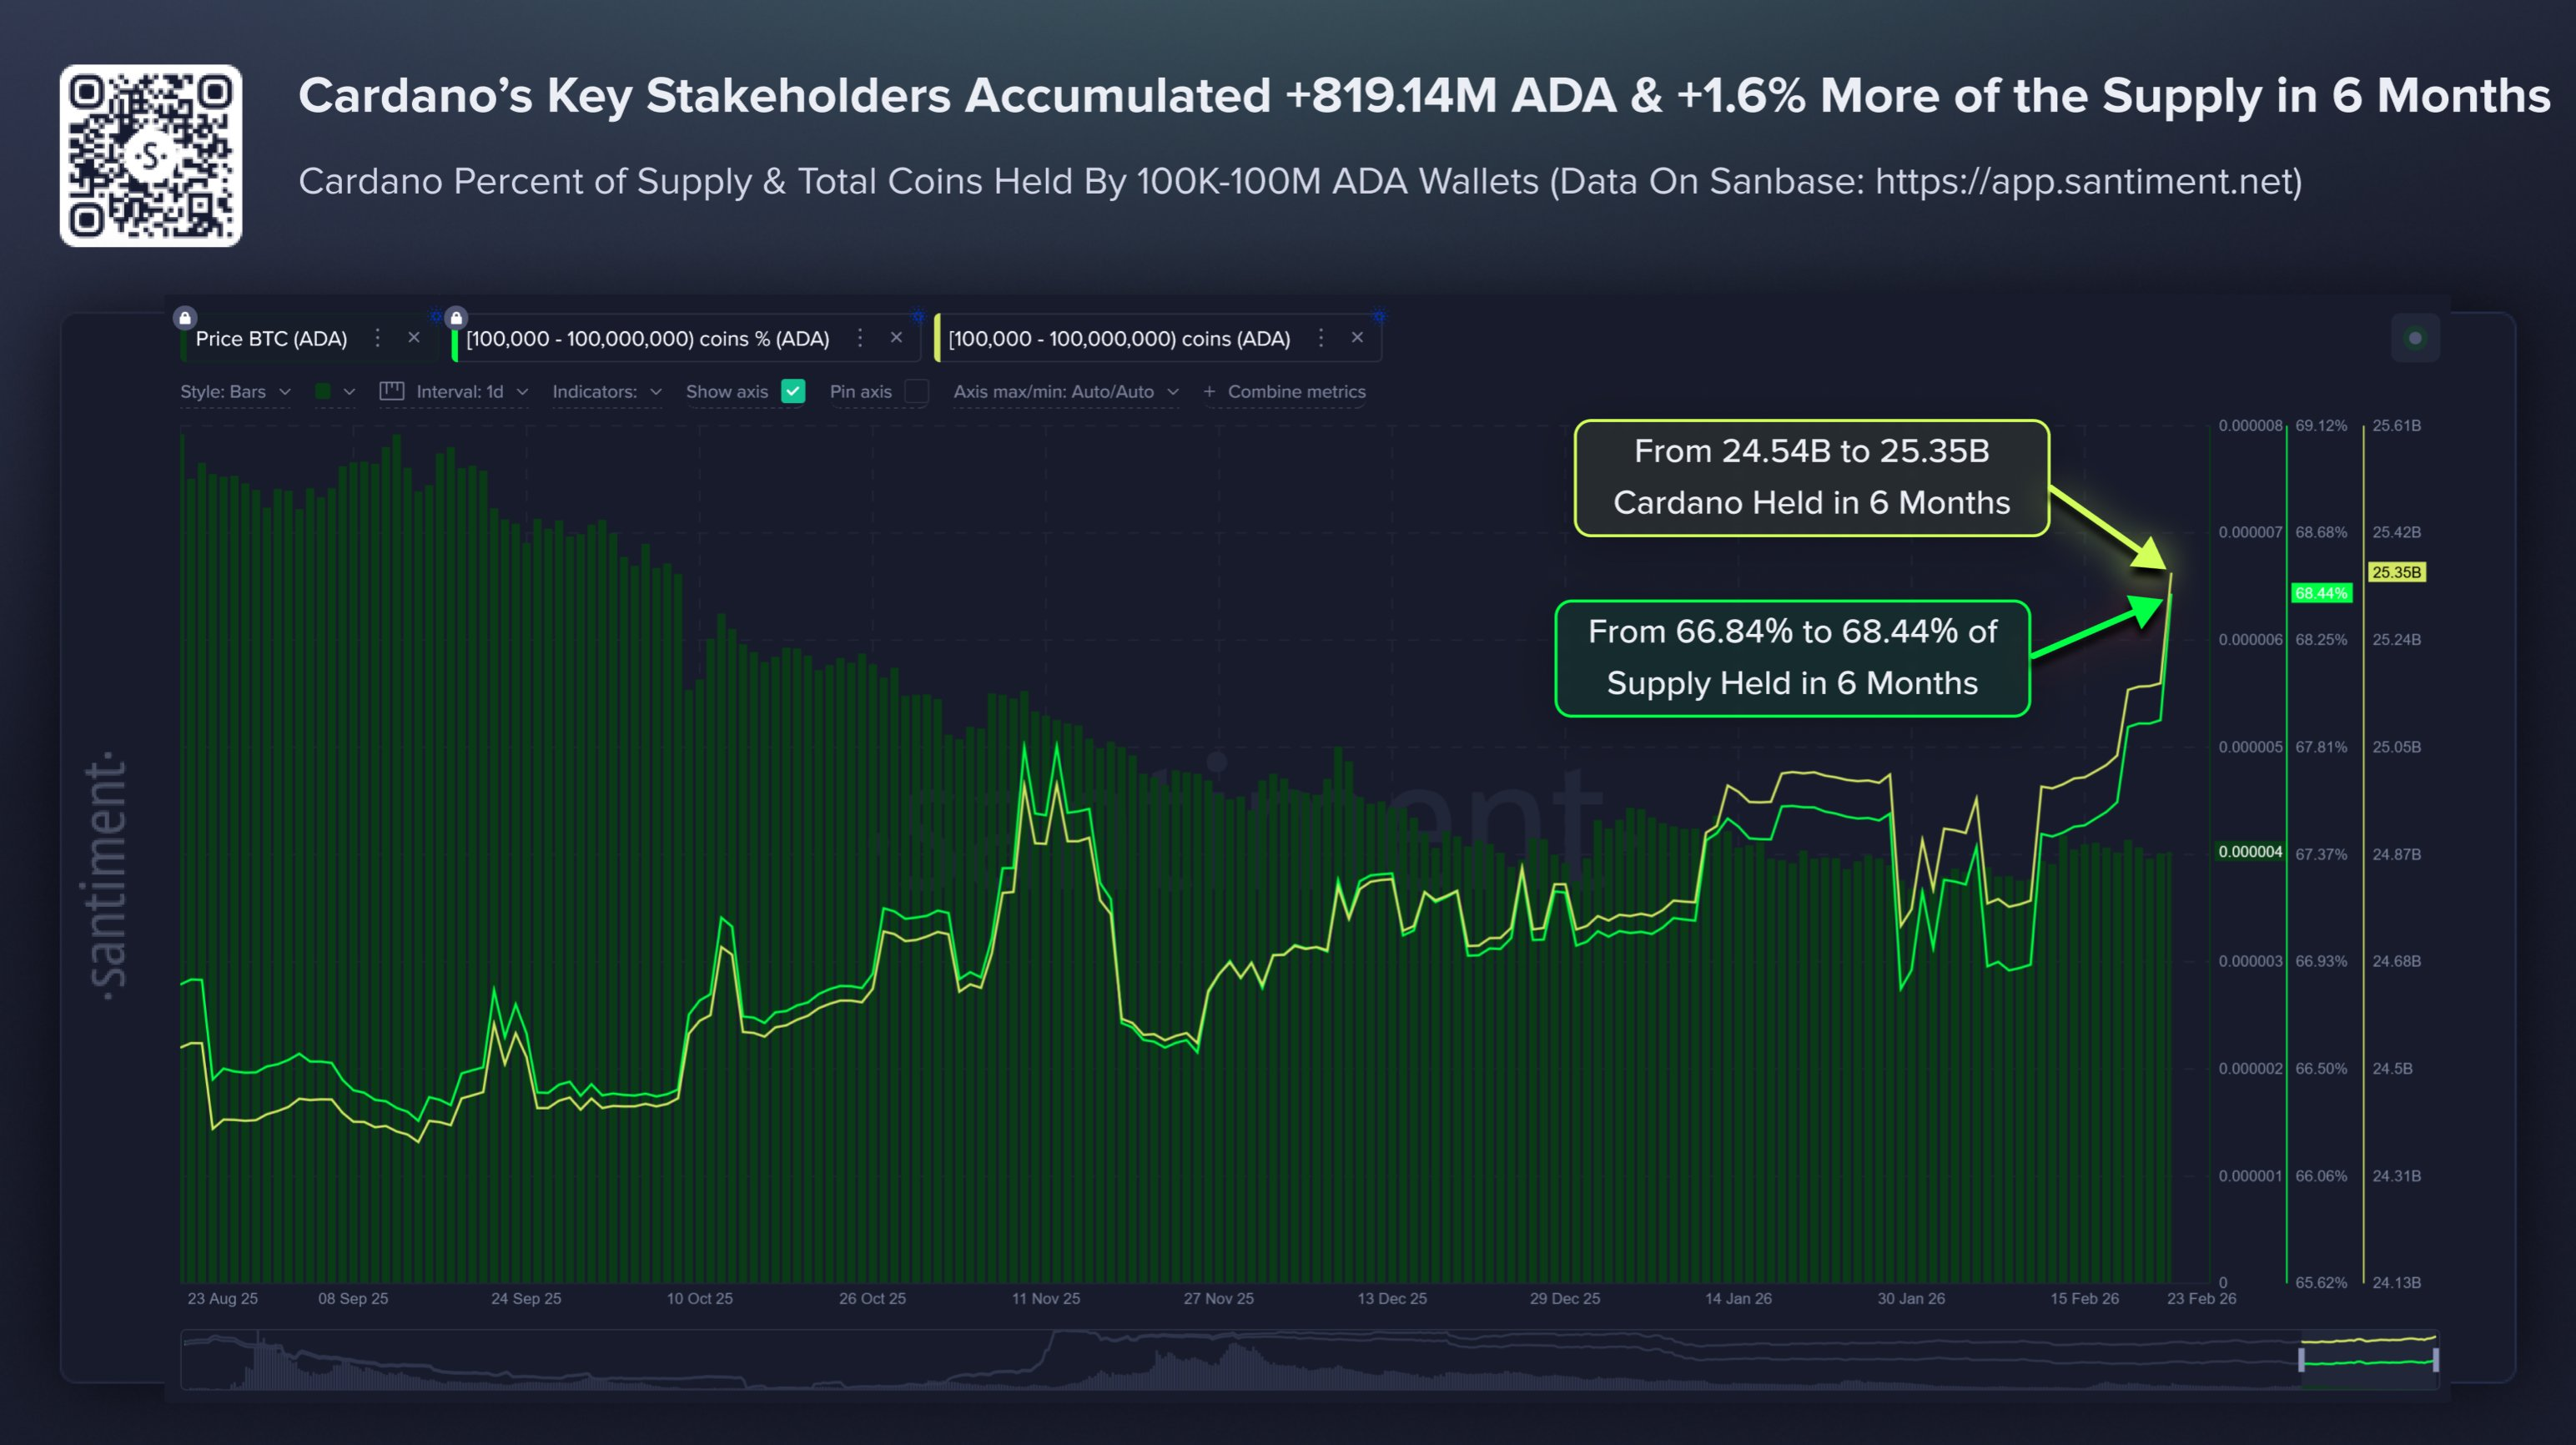 (Source: Santiment)
Notably, this accumulation behavior shows a certain divergence from price trends. During periods of significant ADA price declines, whale addresses have accelerated their accumulation, with an even more pronounced trend since this month. This “counter-trend” positioning is often seen as a signal of bottom-fishing and is used to gauge market sentiment and potential support zones.
(Source: Santiment)
Notably, this accumulation behavior shows a certain divergence from price trends. During periods of significant ADA price declines, whale addresses have accelerated their accumulation, with an even more pronounced trend since this month. This “counter-trend” positioning is often seen as a signal of bottom-fishing and is used to gauge market sentiment and potential support zones.
From an on-chain structural perspective, the continued buying by large wallets not only increases the concentration of holdings but may also influence market volatility in subsequent phases. As whale holdings rise, the tradable circulating supply decreases, often leading to increased price elasticity— a common characteristic of capital behavior in crypto market cycles.
In the short term, ADA has rebounded strongly in the past 24 hours, rising about 14% to around $0.30, indicating that buying momentum is recovering. However, future movement will still depend on overall market sentiment, capital inflow strength, and the stability of key support levels.
The market’s next focus is whether the ongoing accumulation by whales will translate into medium-term upward momentum or is merely a phase of value positioning. If the on-chain accumulation trend continues alongside increased trading volume, Cardano’s price movements, whale holdings, and on-chain capital flows could become key indicators for predicting the next market cycle.
Disclaimer: The information on this page may come from third parties and does not represent the views or opinions of Gate. The content displayed on this page is for reference only and does not constitute any financial, investment, or legal advice. Gate does not guarantee the accuracy or completeness of the information and shall not be liable for any losses arising from the use of this information. Virtual asset investments carry high risks and are subject to significant price volatility. You may lose all of your invested principal. Please fully understand the relevant risks and make prudent decisions based on your own financial situation and risk tolerance. For details, please refer to
Disclaimer.
Related Articles
XRP Holds $1.34 Support While Leverage Heatmap Highlights $1.30 Risk Zone
XRP is trading at $1.36 in a tight range of support at $1.34 and resistance at $1.37.
The heatmap data indicates that there is a huge amount of long positions in the range of $1.30.
Should prices fall to around $1.30, long positions with high leverage in this region might
CryptoNewsLand9m ago
Crypto Market Update – River and Hyperliquid Lead Gainers As Decentralized Infrastructure Gains M...
The crypto market is displaying its typical volatility once again, yet under the noise of price movements, the beginnings of a narrative are starting to take shape. As of today, the “Top Gainers” on CoinMarketCap leans heavily towards projects targeting decentralized infrastructure and fast Layer-1s
BlockChainReporter45m ago
Solana Approaches Key Sell Wall at $84.78 — Will Momentum Hold for a Move Toward $89?
Solana is trading at an approximate price of $83.18, although a solid sell wall is at an approximate price of $84.78, which prevents upward movement.
The price is trapped between the support at $81.99 and the resistance at $84.78 which is short term consolidation.
Once buyers hit the
CryptoNewsLand1h ago
SOL Consolidates Near $84 While Chart Highlights Possible $45 Demand Zone
Solana (SOL) trades at $83.87 within a range defined by $81.03 support and $84.43 resistance, showing consolidation below a $90 supply zone. There is a broader demand area near $45, indicating potential downward movement before recovery.
CryptoNewsLand1h ago
Santiment: The surge in active USDT addresses on a certain public blockchain is correlated with the rebound of BTC
Research firm Santiment found that over the past year, when USDT active addresses on a certain public blockchain surged three times, BTC price rebounded each time, indicating that USDT liquidity has a significant impact on BTC price.
GateNews2h ago
PEPE Consolidates Above $0.05324 Support as Momentum Strengthens and Resistance Near $0.05336 Holds
PEPE has a tight intraday price compression with a support level of $0.053243 and resistance level of $0.053363.
A RSI of 64.13 represents the moderate bullish momentum whereas MACD history is slightly positive, which indicates the gradual buying momentum.
The price is at $0.053364
CryptoNewsLand2h ago