
The Aster price has been stuck in a tight range for weeks, but that quiet period may not last much longer.
Top analyst Ardi pointed out that the token is in its longest consolidation phase ever. In fact, the chart shows that the token has been trading sideways for close to three weeks.
Instead of the token trading up or down, it has been trading in a tight range, repeatedly testing support without breaking it. At writing, the ASTER token is trading at around $0.71.
Here’s What The ASTER Chart Is Showing
The chart shared by trader Ardi shows that ASTER has been defending a key support area around $0.69–$0.70. Several quick dips into that zone were immediately bought up, which suggests buyers are still active at those levels.
Another detail standing out in the ASTER chart is declining trading volume during the consolidation. That type of behavior often appears when markets are quietly building positions before the next move.
Instead of aggressive buying or selling, traders appear to be waiting. According to the analyst, that combination of stable support and shrinking volume can signal a local accumulation phase.
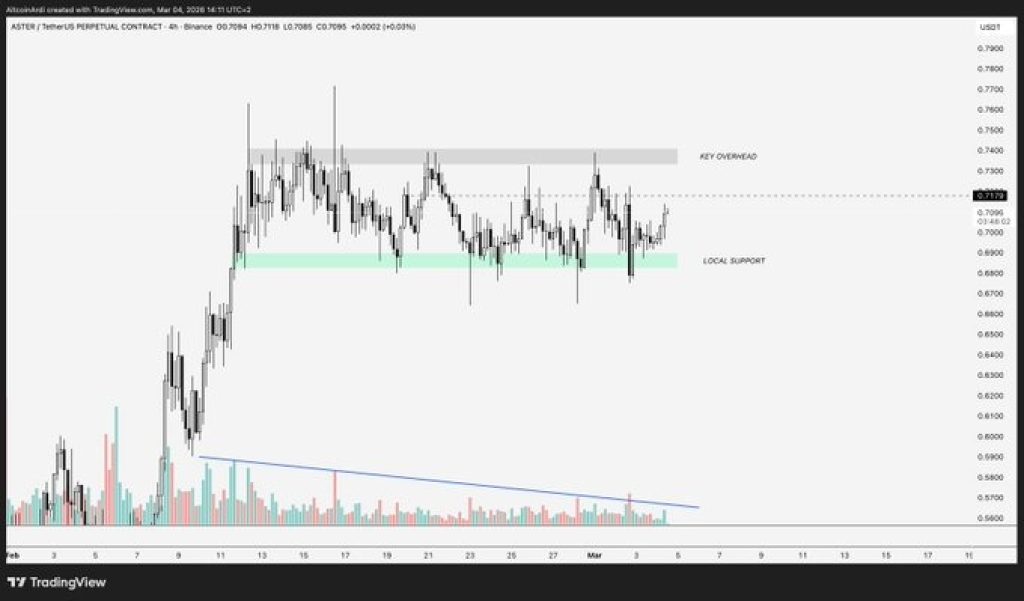
Source: X/Ardi
However, on the upside, the most important level sits around $0.75.That area has acted as a ceiling multiple times during the past few weeks, stopping each rally attempt before it could extend higher.
If the ASTER price manages to break above that level with strong momentum, the next target could come near $0.81, which the analyst describes as a larger macro pivot on the chart.
A move into that region would mark a clear shift in market structure after weeks of sideways action.
_****Pi Coin Price Prediction As Pi Network Prepares Major Upgrade Ahead Of Pi Day**
What’s Next For ASTER?
However, the setup cuts both ways. The longer a market stays trapped in a tight range, the more pressure tends to build. When the breakout finally happens, the move often happens quickly.
If the ASTER price fails to hold the $0.69 support zone, the analyst warns that the downside reaction could be sharp. After weeks of buyers entering the same area, a breakdown could push many of those positions underwater at the same time.
Such a situation may lead to forced selling and drive prices lower.For now, ASTER price remains stuck in a tight range between $0.69-$0.70 support and $0.75 resistance. We’re waiting to see which level will be broken first. Because after three weeks of silence, the next move may not stay quiet for long.
Disclaimer: The information on this page may come from third parties and does not represent the views or opinions of Gate. The content displayed on this page is for reference only and does not constitute any financial, investment, or legal advice. Gate does not guarantee the accuracy or completeness of the information and shall not be liable for any losses arising from the use of this information. Virtual asset investments carry high risks and are subject to significant price volatility. You may lose all of your invested principal. Please fully understand the relevant risks and make prudent decisions based on your own financial situation and risk tolerance. For details, please refer to
Disclaimer.
Related Articles
Why is Bitcoin up today? “Alireza” opens direct negotiations, and Trump demands that Iran “immediately” stop tanker fees
Bitcoin’s official rise today reached $71,800, mainly because Israel and Lebanon have begun direct negotiations, reducing market concerns about an Iran ceasefire agreement. In addition, a weaker US dollar and continued buying by institutional investors also pushed prices higher. On the technical side, Bitcoin’s key support levels are $68,500 to $70,000. A break above $76,000 to $78,000 could prompt another test of $80,000 to $85,000.
MarketWhisper24m ago
Gold falls to $4,758, the BTC Volatility Index drops 1.77%, and WTI crude oil rises 0.44%
April 10, gold and silver prices fell slightly, trading at $4,758.37 per ounce and $75.165 per ounce, respectively. The Bitcoin Volatility Index (BVIX) dropped to 44.36, and in the foreign exchange market, the U.S. dollar rose against the offshore yuan and the Japanese yen. Major European stock indexes generally declined, while WTI and Brent crude oil rose slightly. The Gate platform supports trading a variety of financial market products.
GateNews30m ago
Israel agrees to negotiations with Lebanon, US stocks rally, and Bitcoin briefly spikes to 73K
Israeli Prime Minister Benjamin Netanyahu agrees to hold direct negotiations with Lebanon. This news boosts gains in the U.S. stock market’s S&P 500, while oil prices fall. Bitcoin’s price briefly rose to 73K; market sentiment improved slightly, but overall it has not fully rebounded. Trump urged Iran to stop its attacks to facilitate negotiations, but shipping through the strait has not improved yet.
ChainNewsAbmedia1h ago
BTC 15-minute drop of 0.42%: Large-amount net outflows and geopolitical risk-off sentiment weigh on the short-term market
From 22:30 to 22:45 (UTC) on 2026-04-09, the BTC price briefly dipped within a 0.46% amplitude range. The return was recorded at -0.42%, and the price fluctuated between 72,298.3 and 72,631.6 USDT.
During this period, market attention warmed up. Trading volume for short-term active orders increased alongside heightened volatility, and overall sentiment turned cautious.
The main driving forces behind this unusual move were net outflows of large exchange funds and a liquidity bottleneck. On-chain data shows that over the past 24 hours, the BTC exchange large-net-outflow amount reached -559.08 BTC, directly reflecting institutions and Large Investors
GateNews2h ago
XRP Whales Accumulate as Ripple Executives Head to Key XRPL Event in Japan
XRP has gained 5% from a support level of $1.28 due to increased whale accumulation, with large holders now buying over 11 million XRP daily. Ripple executives are attending a significant XRPL event in Japan, though broader market sentiment remains cautious amid geopolitical tensions.
CryptoNewsFlash5h ago
Onchain Perp DEX Volume Falls for Fifth Straight Month as March Drops to $699B
Onchain perpetual futures trading has sharply declined for five consecutive months, with March 2026 volume dropping to $699 billion from a peak of $1.36 trillion in October 2025. Hyperliquid dominates the market, capturing 34% of recent trading activity.
CryptoNewsFlash5h ago
