DemonCultBrother-In-Law
Trade
Basic
Futures
Futures
Hundreds of contracts settled in USDT or BTC
Options
HOT
Trade European-style vanilla options
Unified Account
Maximize your capital efficiency
Demo Trading
Futures Kickoff
Get prepared for your futures trading
Futures Events
Participate in events to win generous rewards
Demo Trading
Use virtual funds to experience risk-free trading
Earn
Launch
CandyDrop
Collect candies to earn airdrops
Launchpool
Quick staking, earn potential new tokens
HODLer Airdrop
Hold GT and get massive airdrops for free
Launchpad
Be early to the next big token project
Alpha Points
NEW
Trade on-chain assets and enjoy airdrop rewards!
Futures Points
NEW
Earn futures points and claim airdrop rewards
Investment
Simple Earn
Earn interests with idle tokens
Auto-Invest
Auto-invest on a regular basis
Dual Investment
Buy low and sell high to take profits from price fluctuations
Soft Staking
Earn rewards with flexible staking
Crypto Loan
0 Fees
Pledge one crypto to borrow another
Lending Center
One-stop lending hub
VIP Wealth Hub
Customized wealth management empowers your assets growth
Private Wealth Management
Customized asset management to grow your digital assets
Quant Fund
Top asset management team helps you profit without hassle
Staking
Stake cryptos to earn in PoS products
Smart Leverage
NEW
No forced liquidation before maturity, worry-free leveraged gains
GUSD Minting
Use USDT/USDC to mint GUSD for treasury-level yields
More
Promotions
Activity Center
Join activities and win big cash prizes and exclusive merch
Referral
20 USDT
Earn 40% commission or up to 500 USDT rewards
Announcements
Announcements of new listings, activities, upgrades, etc
Gate Blog
Crypto industry articles
VIP Services
Huge fee discounts
Proof of Reserves
Gate promises 100% proof of reserves
DemonCultBrother-in-law
No content yet
Pin
- Reward
- like
- 1
- Repost
- Share
DemonCultBrother-In-Law:
iOS SubscriptionLatest Mrs. Point Position Sharing
View OriginalSubscribers Only
Subscribe now to view exclusive content- Reward
- like
- Comment
- Repost
- Share
- Reward
- like
- 1
- Repost
- Share
DemonCultBrother-In-Law:
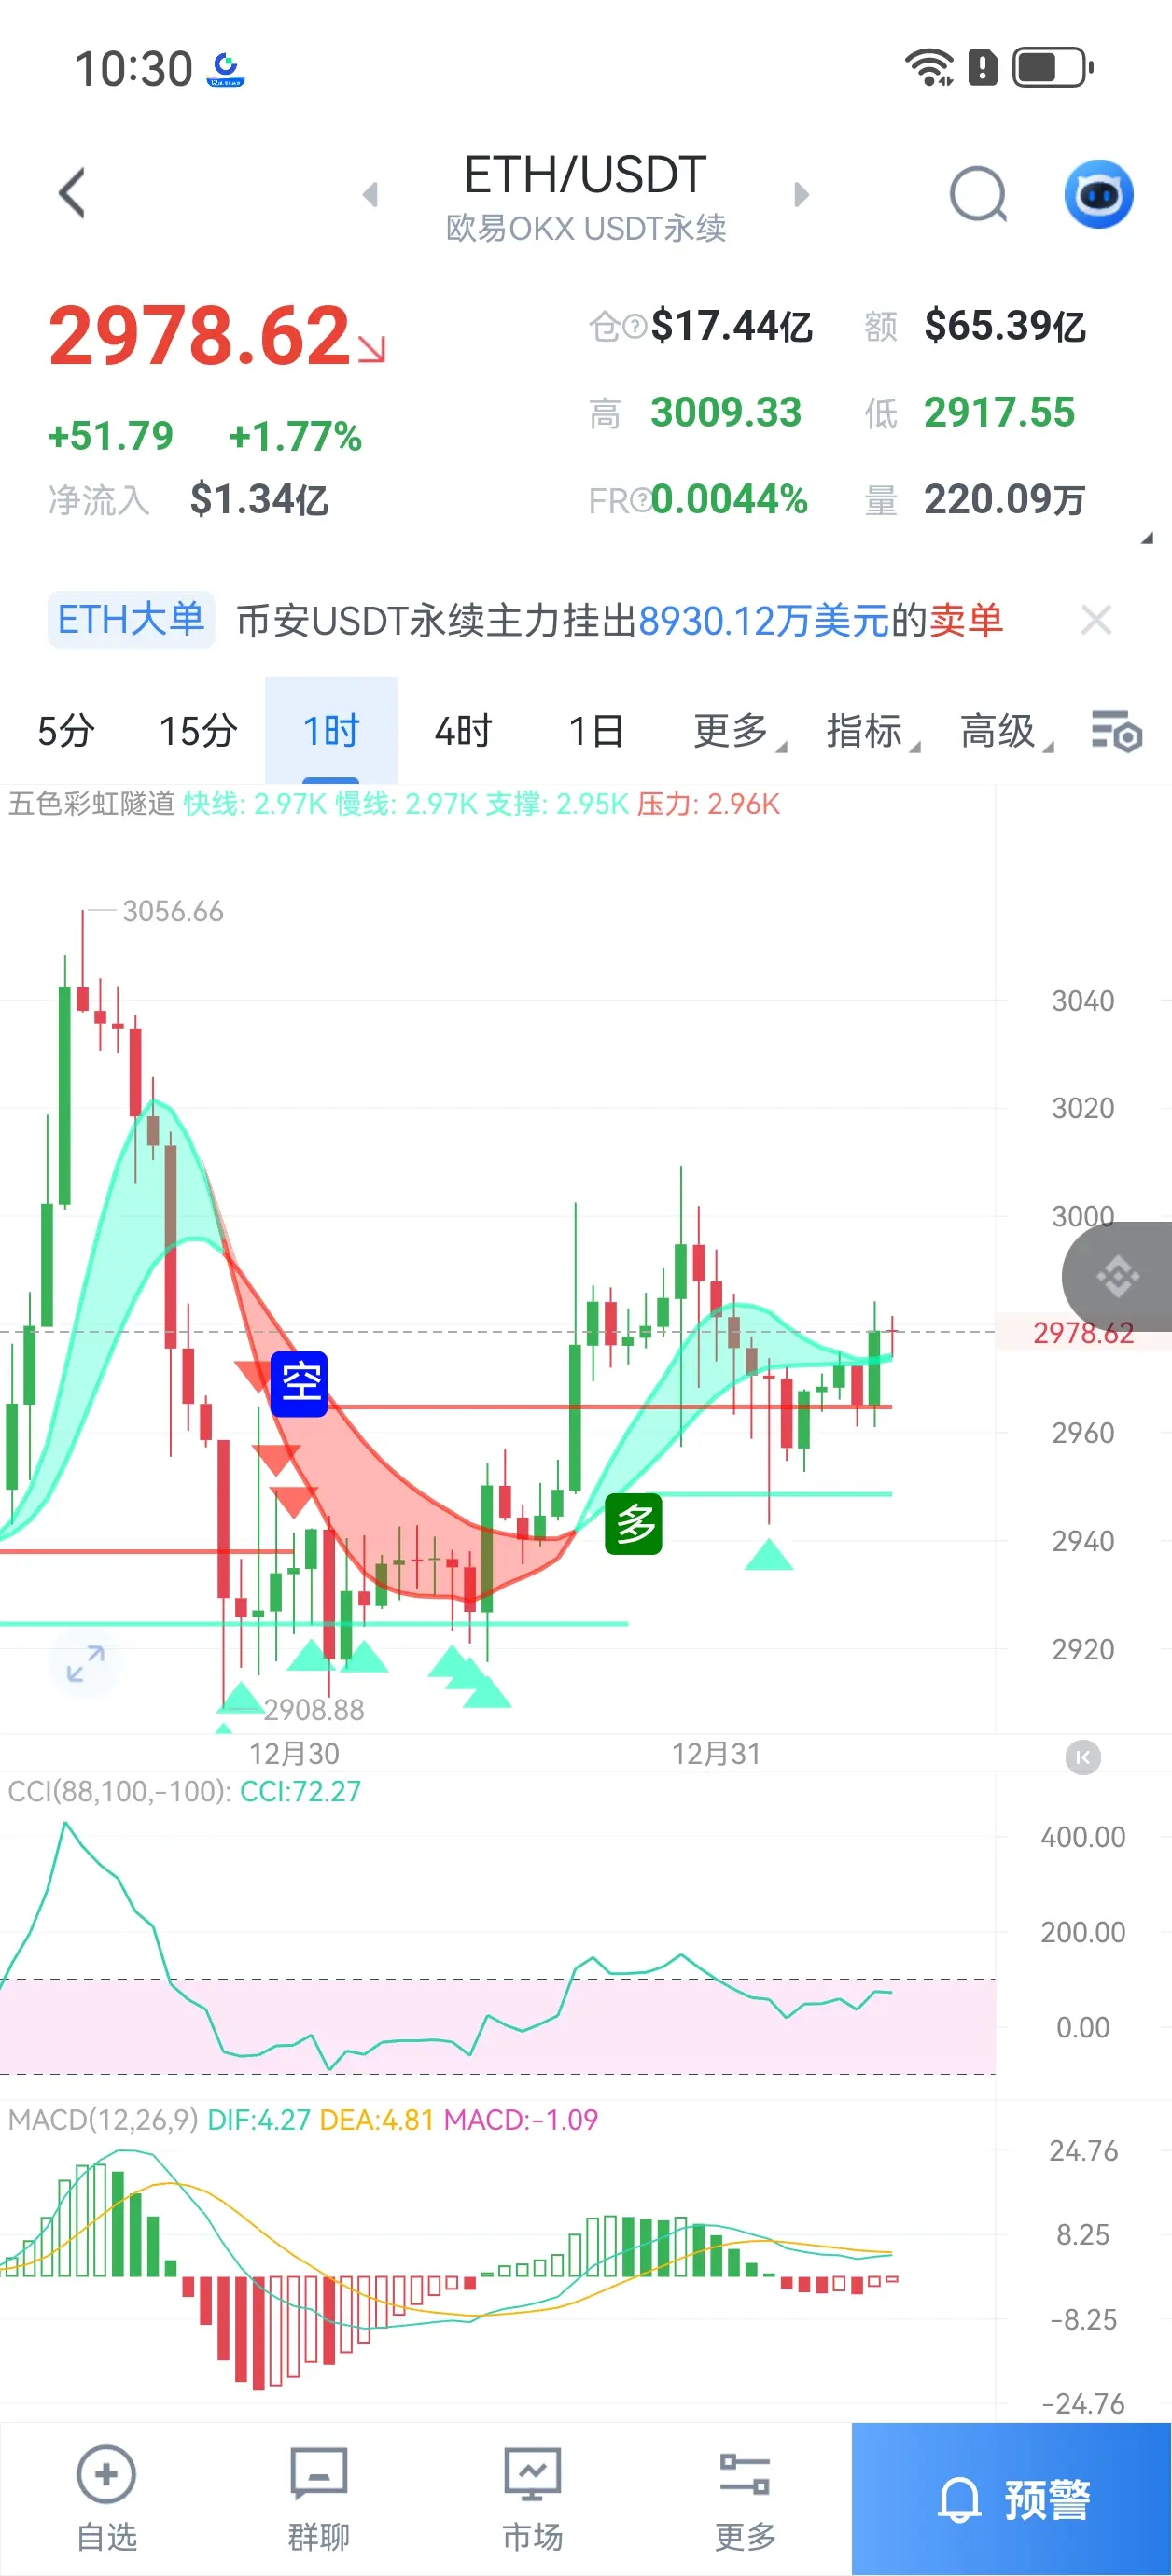
New Year Wealth Explosion 🤑Ethereum's actuarial science. Navigation. I don't know if you can understand it. But I hope you take a serious look. I don't know if I can hold on. But I hope you can support me. $ETH $BTC #GateCEO2025年终公开信
View Original

- Reward
- 2
- 8
- Repost
- Share
PhantomCloud :
:
2026 Go Go Go 👊View More
If you insist on trading contracts, remember these points!
1. Trading contracts is about leveraging small amounts for big gains. Losses are normal. However, after hitting a stop-loss, there are two types of people: some will recklessly open new positions, while others will enter a cooling-off period.
My advice is that if you encounter frequent stop-losses, you should stay calm, temporarily stop trading, and adjust your strategy.
2. Don't rush for quick success. Trading is not a get-rich-quick scheme. When experiencing losses, stay calm, avoid rushing to open new positions, and never over-lever
View Original1. Trading contracts is about leveraging small amounts for big gains. Losses are normal. However, after hitting a stop-loss, there are two types of people: some will recklessly open new positions, while others will enter a cooling-off period.
My advice is that if you encounter frequent stop-losses, you should stay calm, temporarily stop trading, and adjust your strategy.
2. Don't rush for quick success. Trading is not a get-rich-quick scheme. When experiencing losses, stay calm, avoid rushing to open new positions, and never over-lever

- Reward
- like
- 1
- Repost
- Share
DemonCultBrother-In-Law:
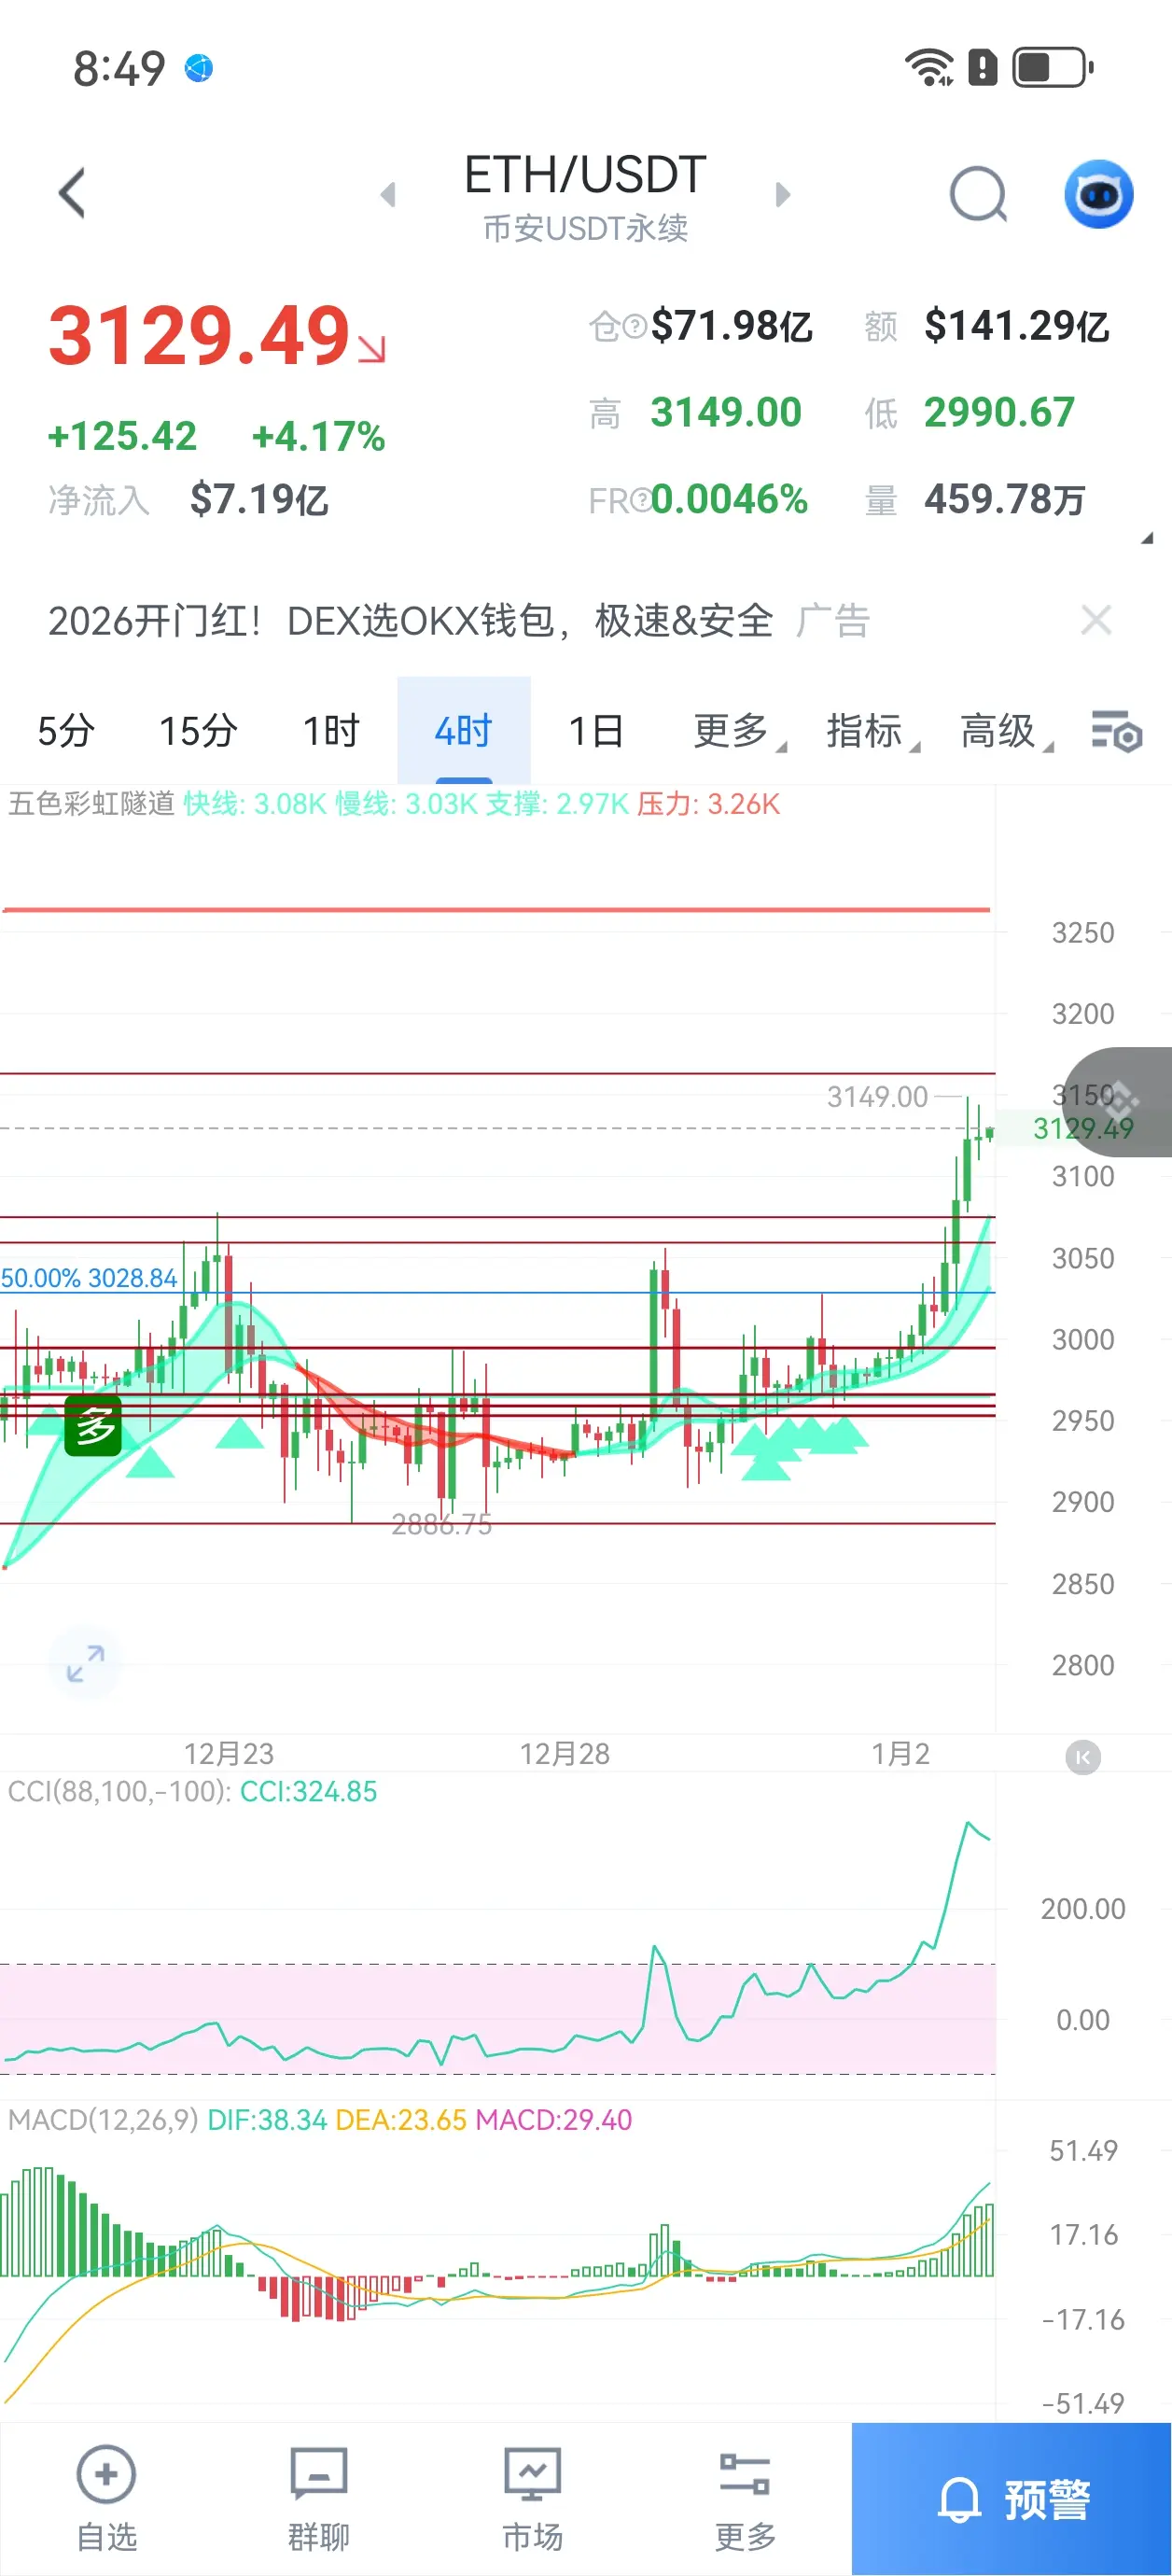
New Year Wealth Explosion 🤑Price Trend Analysis
1. Candlestick Patterns: $ETH $BTC #GateCEO2025年终公开信
- Recent candlesticks show a clear bullish trend, with the price gradually rising from around 2970 to the current level of approximately 3130.
- On January 02, a long bullish candle broke through, reaching a high of 3150 before pulling back, forming an upper shadow, indicating some resistance in that area.
2. Technical Indicators:
- MACD: DIF and DEA are both above the zero line, with DIF continuously diverging upward, indicating the market is in a strong upward phase, but caution is advised for potential short-t
View Original1. Candlestick Patterns: $ETH $BTC #GateCEO2025年终公开信
- Recent candlesticks show a clear bullish trend, with the price gradually rising from around 2970 to the current level of approximately 3130.
- On January 02, a long bullish candle broke through, reaching a high of 3150 before pulling back, forming an upper shadow, indicating some resistance in that area.
2. Technical Indicators:
- MACD: DIF and DEA are both above the zero line, with DIF continuously diverging upward, indicating the market is in a strong upward phase, but caution is advised for potential short-t

- Reward
- like
- Comment
- Repost
- Share
This is the Ethereum exclusive strategy. Brothers, come on. A dog head can solve all problems.
View OriginalSubscribers Only
Subscribe now to view exclusive content- Reward
- like
- Comment
- Repost
- Share
Brothers, the latest position sharing. Are you ready?
View OriginalSubscribers Only
Subscribe now to view exclusive content- Reward
- like
- Comment
- Repost
- Share
- Reward
- like
- Comment
- Repost
- Share
Latest price points are now public. Are there any upcoming ones? The direct upload is a screenshot of the order placement.
View OriginalSubscribers Only
Subscribe now to view exclusive content- Reward
- like
- Comment
- Repost
- Share
Brothers, you can check out the latest point positions.
View OriginalSubscribers Only
Subscribe now to view exclusive content- Reward
- like
- Comment
- Repost
- Share
The 4 Basic Concepts of Contracts Every Beginner Must Know
(Margin, Leverage, Liquidation, Funding Rate)
Many people enter contracts → and get liquidated immediately
The reason isn’t that they can’t read the market, but that they don’t understand the basic concepts. Today, in 3 minutes, I’ll help you understand the fundamental concepts of contracts!
Margin
Definition:
Margin is the principal amount you deposit when opening a contract.
Leverage
Definition:
Leverage is a multiplier that amplifies your position, allowing you to make a small investment for a larger gain.
For example:
· 100U \times
View Original(Margin, Leverage, Liquidation, Funding Rate)
Many people enter contracts → and get liquidated immediately
The reason isn’t that they can’t read the market, but that they don’t understand the basic concepts. Today, in 3 minutes, I’ll help you understand the fundamental concepts of contracts!
Margin
Definition:
Margin is the principal amount you deposit when opening a contract.
Leverage
Definition:
Leverage is a multiplier that amplifies your position, allowing you to make a small investment for a larger gain.
For example:
· 100U \times

- Reward
- 14
- 11
- Repost
- Share
DemonCultBrother-In-Law:
Apple Subscriptionhttps://www.gate.com/zh/profile/%E9%AD%94%E6%95%99%E5%A7%90%E5%A4%ABView More
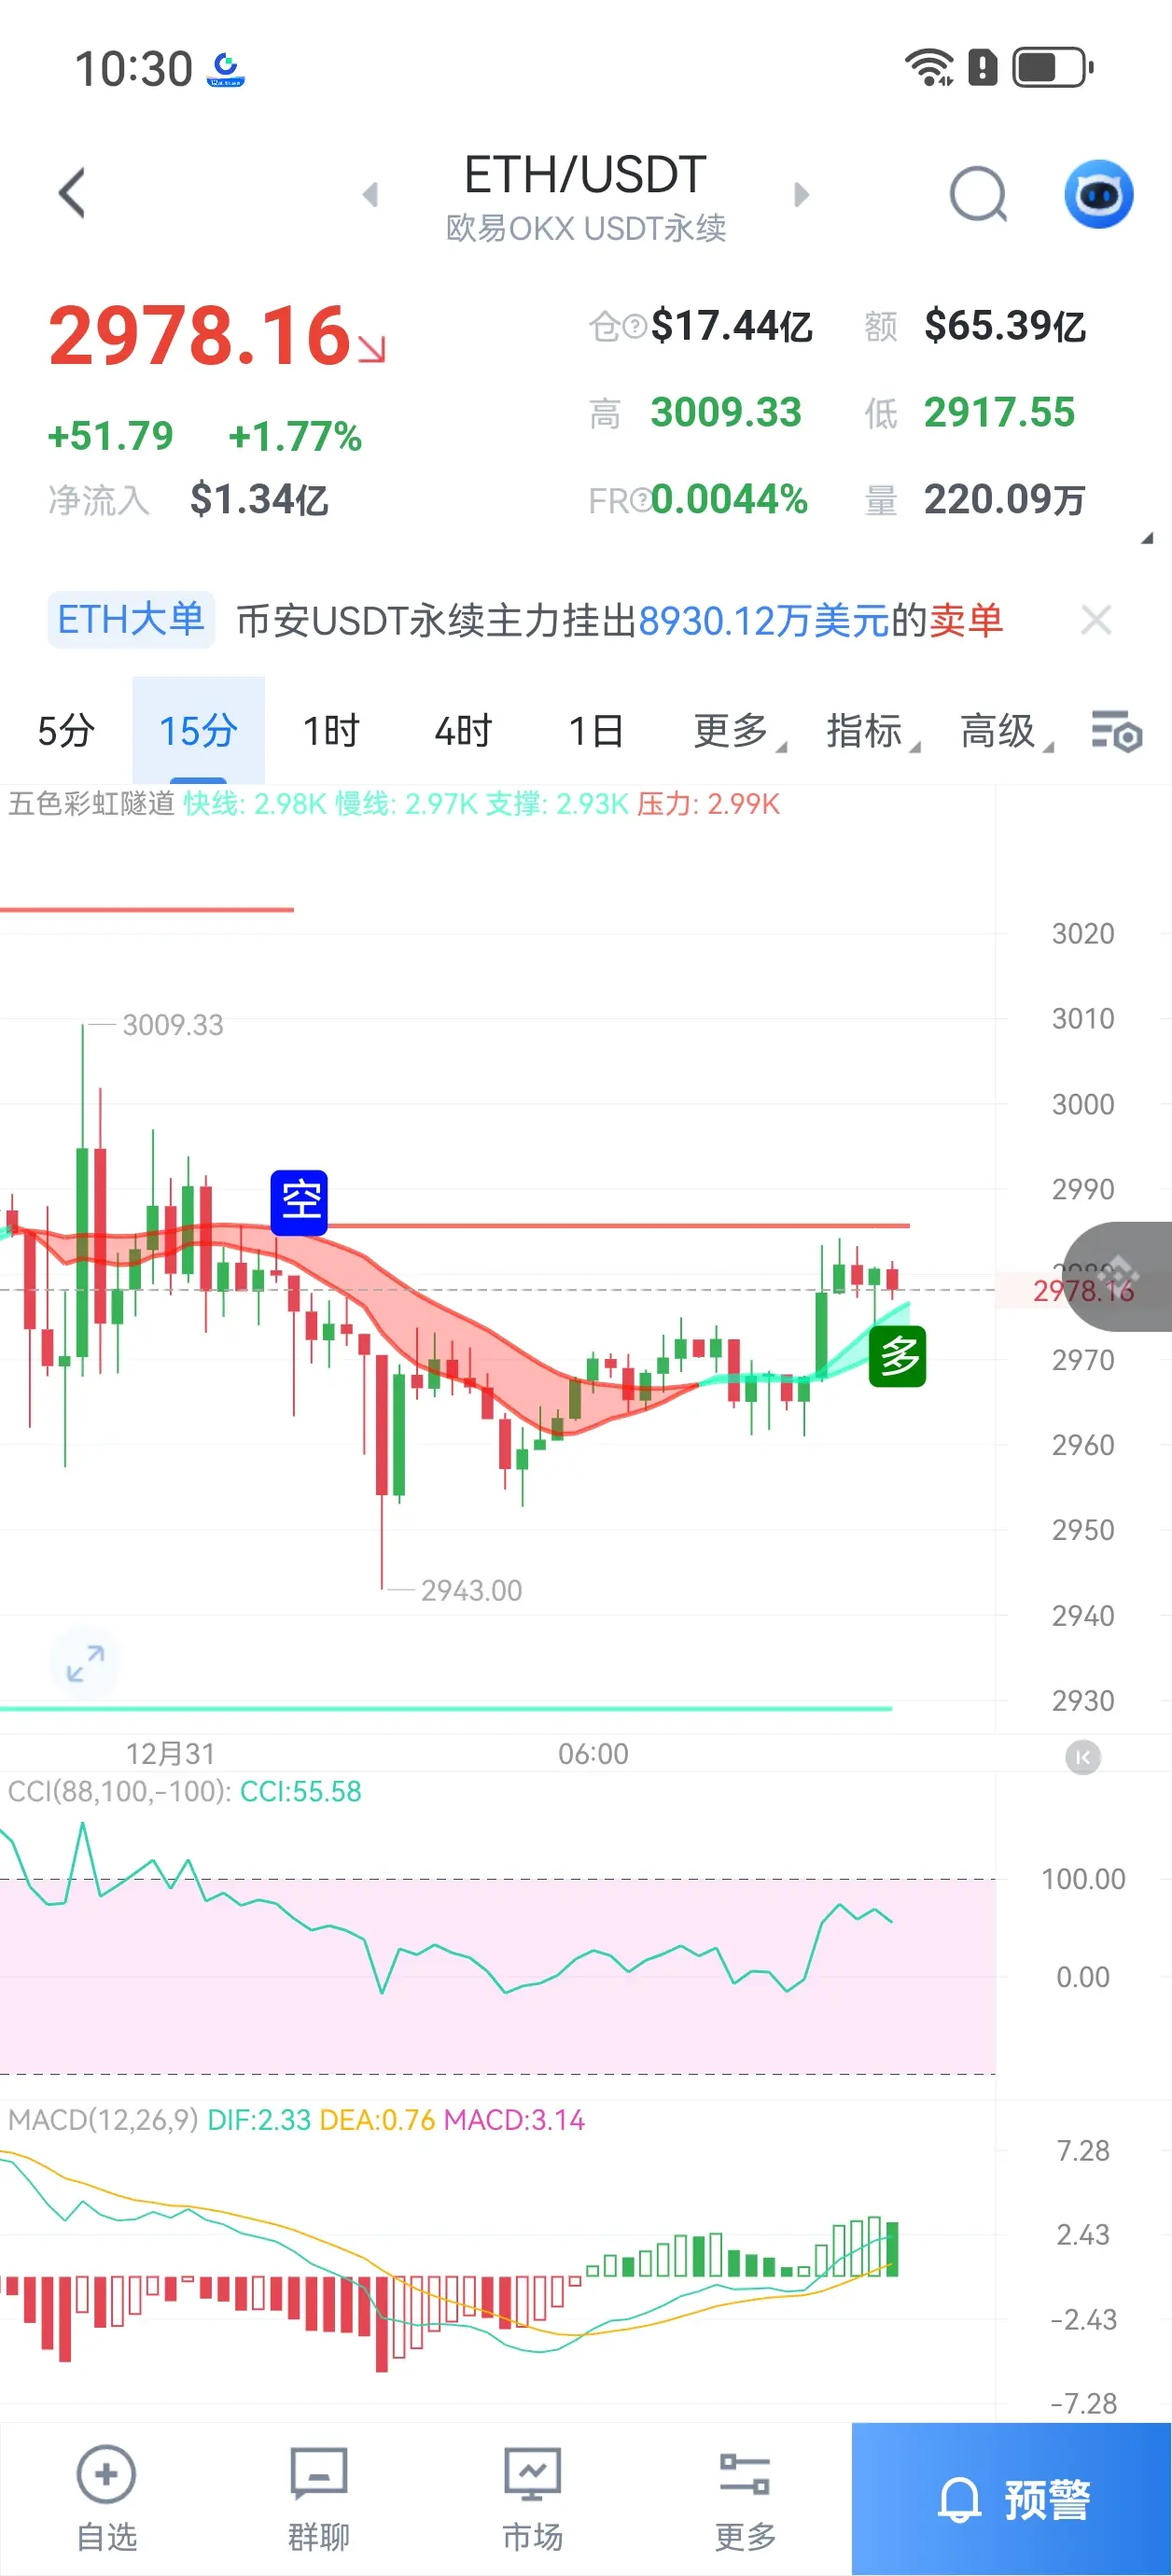
Ethereum Trend Analysis
1. K-line Pattern:
- Recent prices show a oscillating upward trend, with lows gradually rising and highs continuously breaking through.
- Longer bullish candles formed on December 31 and January 2, indicating strengthening bullish momentum.
2. Technical Indicators:
- MACD: DIF and DEA are both above the zero line, with DIF continuously diverging upward, indicating a strong upward trend.
- RSI: RSI14 is at 60.32, approaching the overbought zone but not yet in extreme territory, suggesting room for further gains.
- EMA: Short-term EMA7 (2991.30) has clearly cross
View Original1. K-line Pattern:
- Recent prices show a oscillating upward trend, with lows gradually rising and highs continuously breaking through.
- Longer bullish candles formed on December 31 and January 2, indicating strengthening bullish momentum.
2. Technical Indicators:
- MACD: DIF and DEA are both above the zero line, with DIF continuously diverging upward, indicating a strong upward trend.
- RSI: RSI14 is at 60.32, approaching the overbought zone but not yet in extreme territory, suggesting room for further gains.
- EMA: Short-term EMA7 (2991.30) has clearly cross

- Reward
- like
- 1
- Repost
- Share
DemonCultBrother-In-Law:
In the face of global turmoil, everyone wants to tear off the cloak of peace and control the world. We are willing to work with all parties to navigate between the two forces, playing both sides and continuously maneuvering in the middle.This is the Ethereum special session. Professionally providing ETH.
View OriginalSubscribers Only
Subscribe now to view exclusive content- Reward
- like
- 1
- Repost
- Share
DemonCultBrother-In-Law:
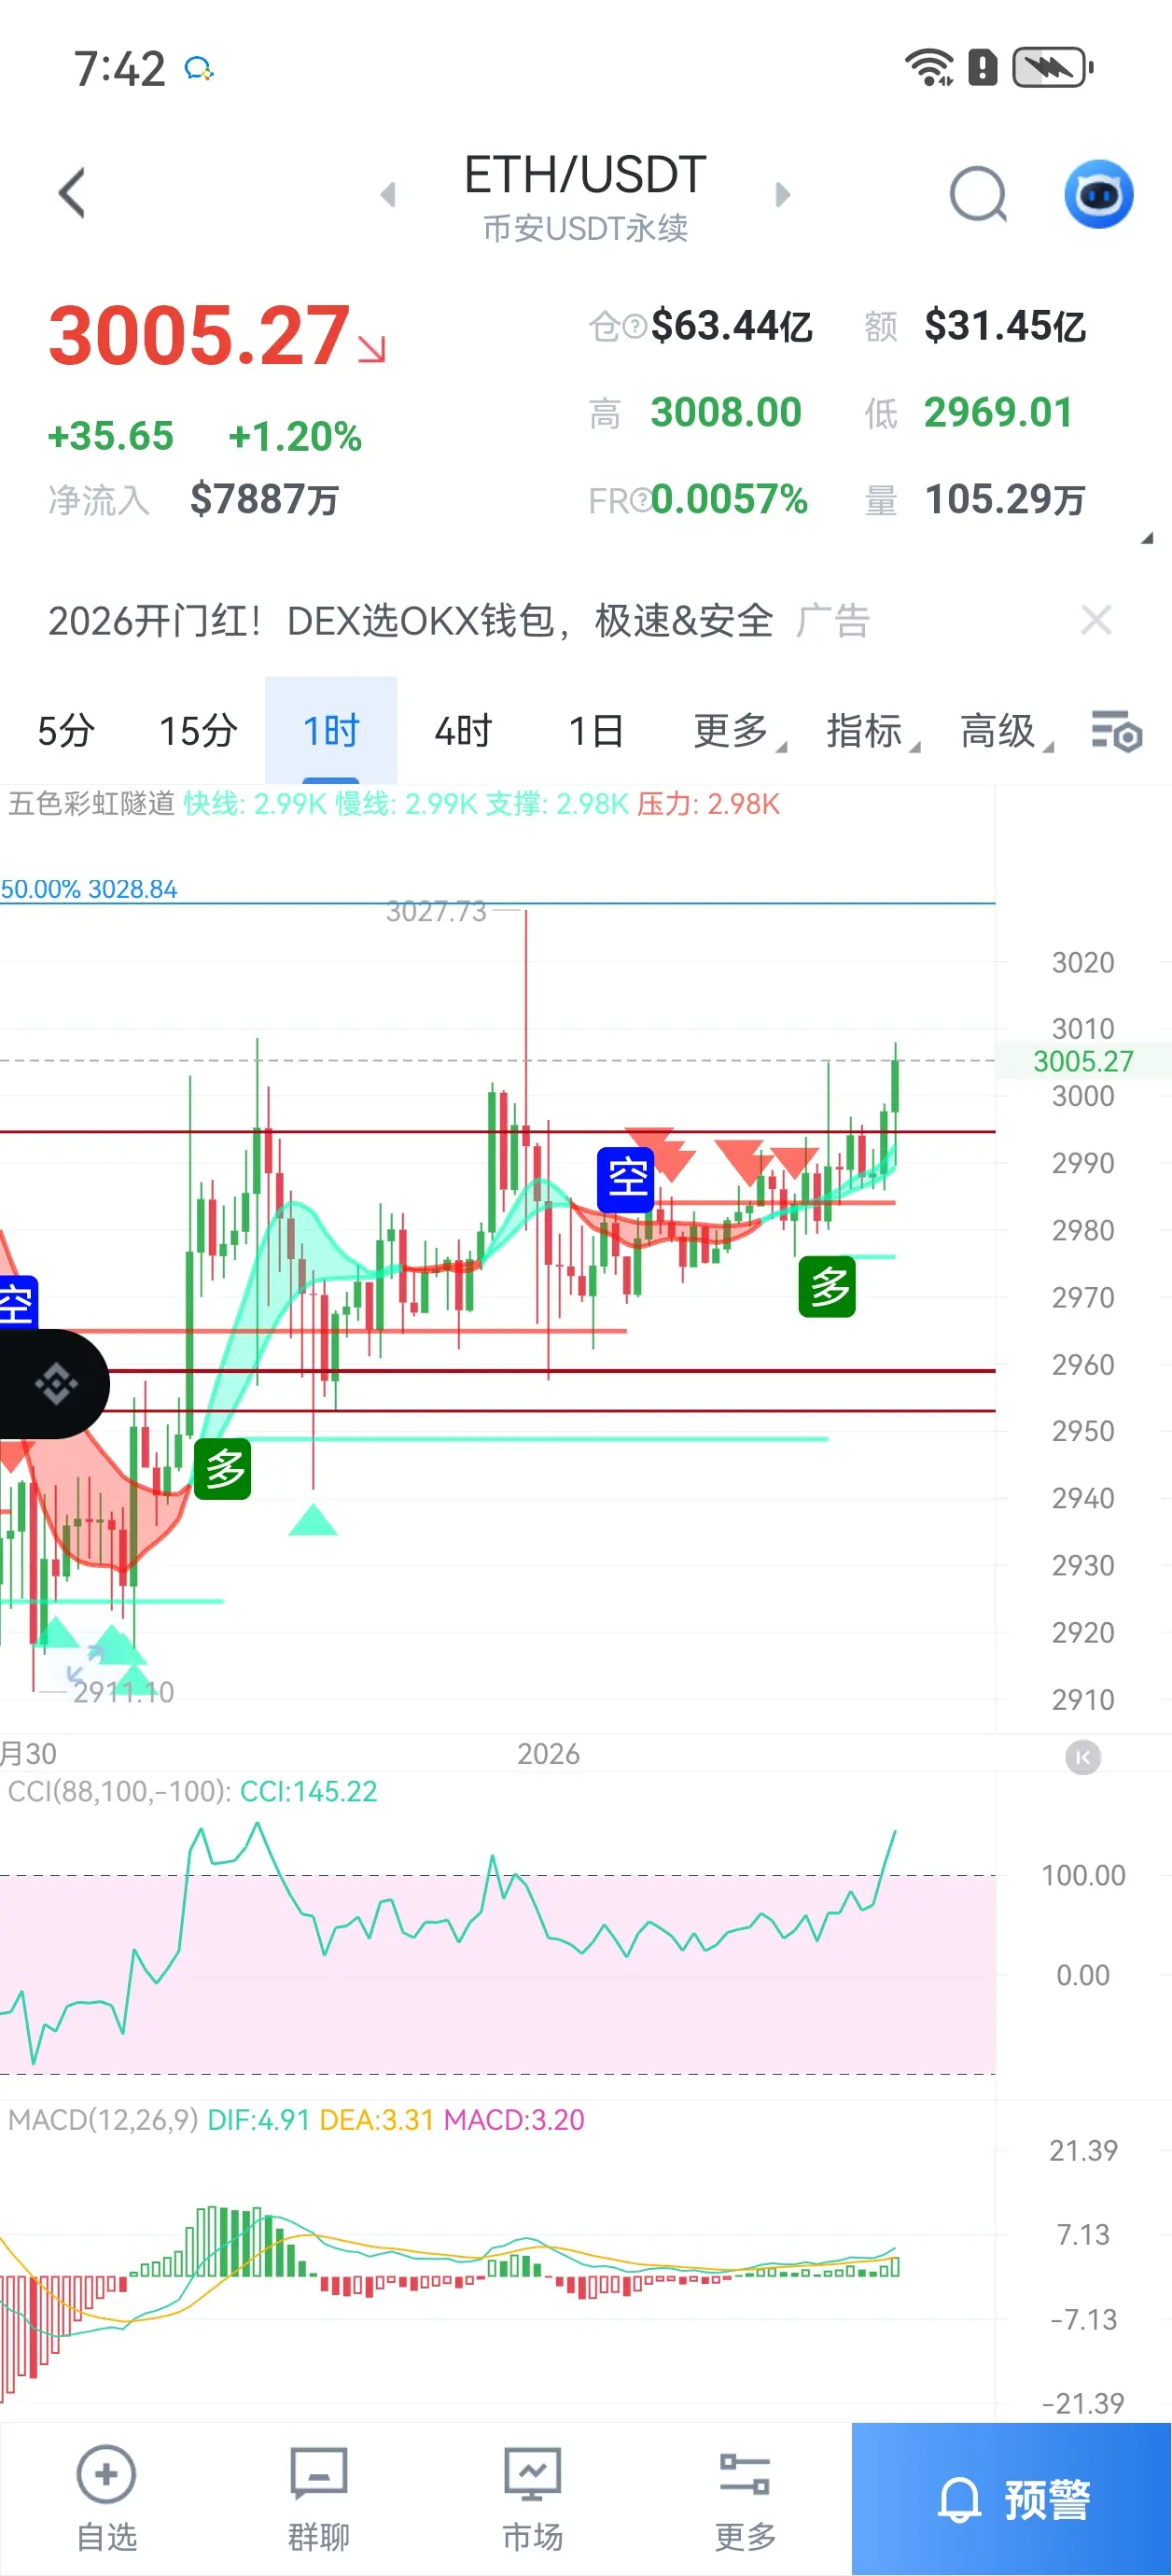
New Year Wealth Explosion 🤑Price Trend Analysis
1. Candlestick Patterns:
- Recent prices have been fluctuating within the 2950 to 3050 range, with a long upper shadow on December 29th, indicating significant selling pressure above.
- The latest few candlesticks have small bodies, showing that bullish and bearish forces are approaching balance, but there is still some downside risk.
2. Technical Indicators:
- MACD: The 4-hour DIF and DEA averages are converging upward, with the red histograms shortening, indicating weakening momentum; on the daily chart, MACD is near the zero line, with no clear trend.
- RSI: The 4
View Original1. Candlestick Patterns:
- Recent prices have been fluctuating within the 2950 to 3050 range, with a long upper shadow on December 29th, indicating significant selling pressure above.
- The latest few candlesticks have small bodies, showing that bullish and bearish forces are approaching balance, but there is still some downside risk.
2. Technical Indicators:
- MACD: The 4-hour DIF and DEA averages are converging upward, with the red histograms shortening, indicating weakening momentum; on the daily chart, MACD is near the zero line, with no clear trend.
- RSI: The 4

- Reward
- 4
- 3
- Repost
- Share
GateUser-d9db9896 :
:
2026 Go Go Go 👊View More
Latest point, exclusive for Mrs.
View OriginalSubscribers Only
Subscribe now to view exclusive content- Reward
- like
- Comment
- Repost
- Share
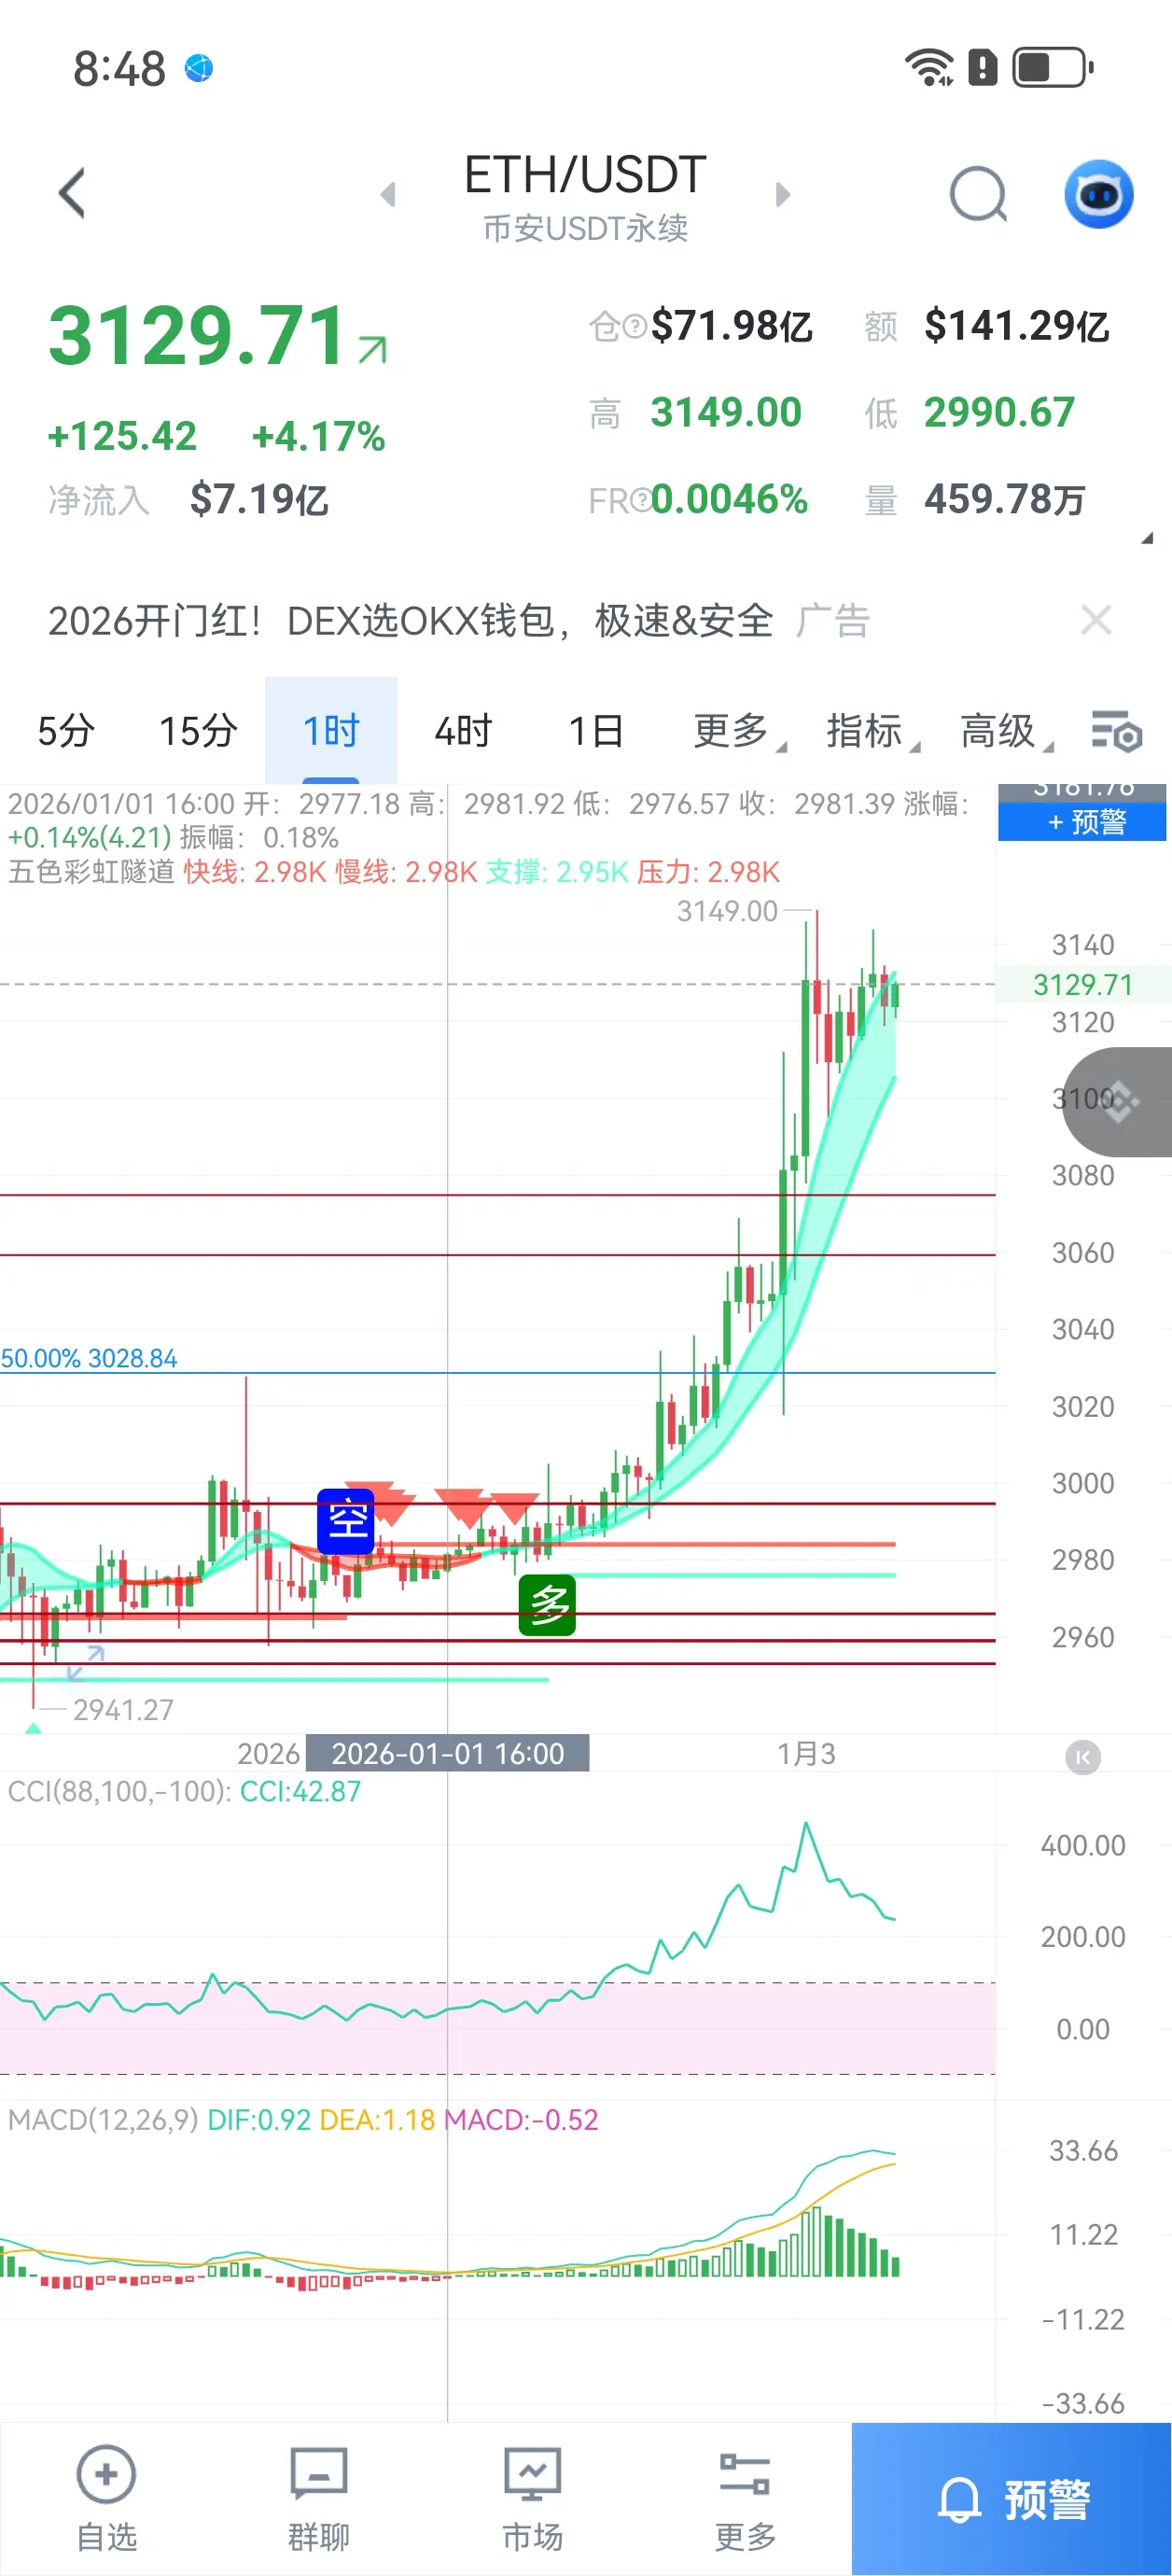
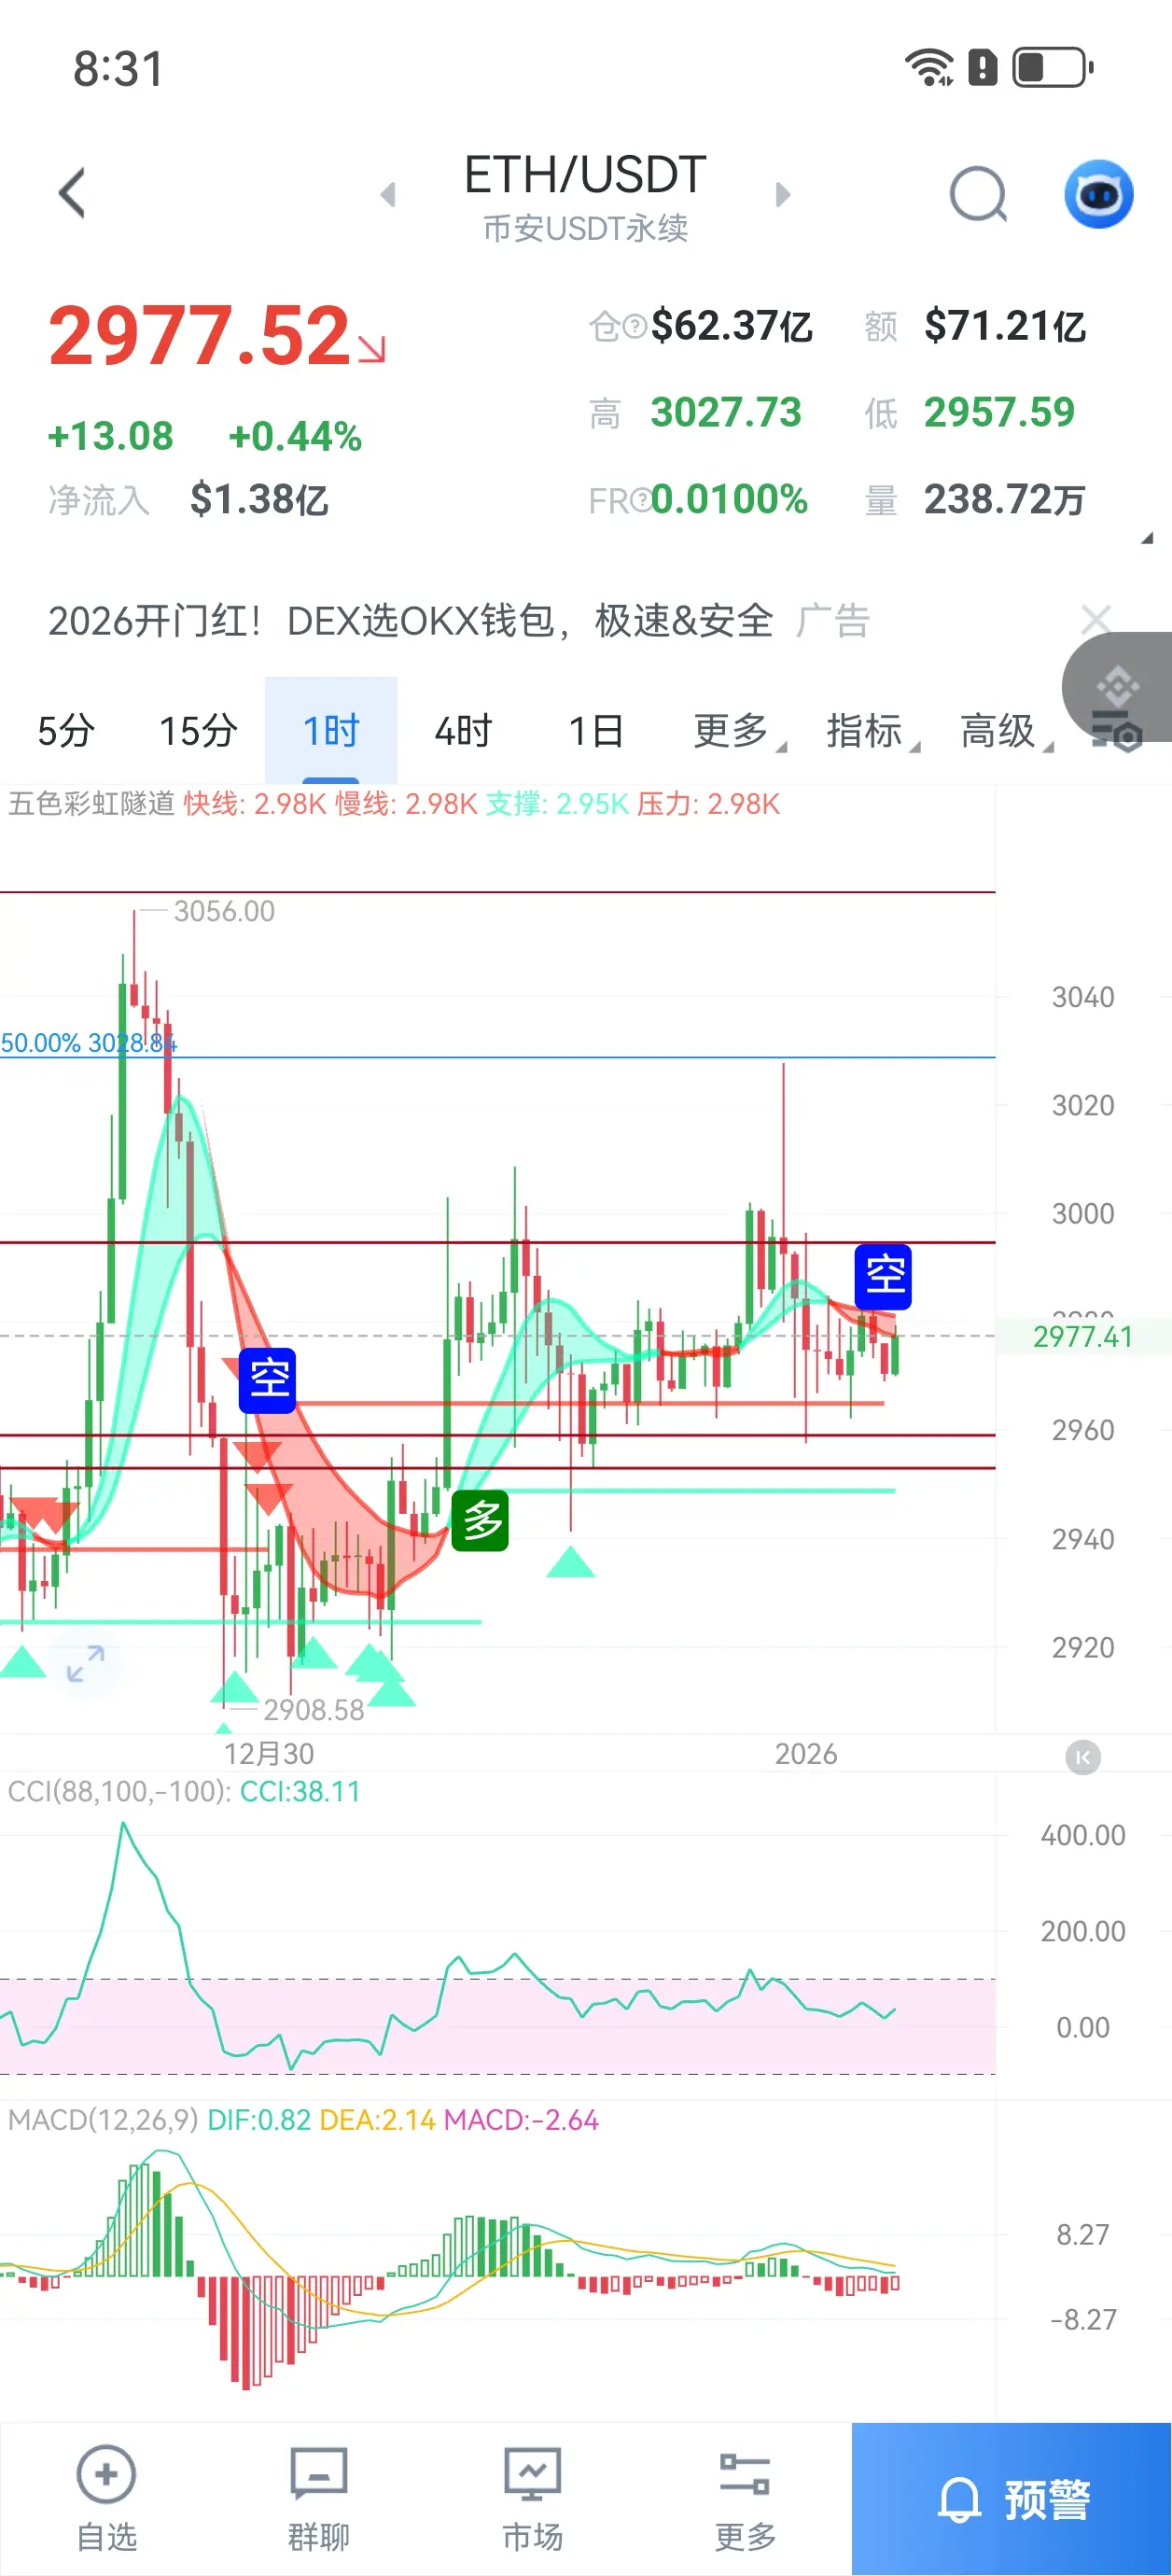
【Buy and Sell Points】
- Buy Point 1: 2950 USDT (Reason: Close to the previous wave low, also near the EMA30 support level at 2959.73, with an integer threshold providing strong support)
- Buy Point 2: 2925 USDT (Reason: Further decline to near the December 27 opening price, an important support area, and close to the previous low of 2919.44)
- Long Stop Loss Point: 2910 USDT (Reason: 15 USDT below Buy Point 2, confirming support loss after breaking below the December 30 low of 2919.44)
- Sell Point 1: 3000 USDT (Reason: Significant psychological barrier at the integer level, close to recent hi
View Original- Buy Point 1: 2950 USDT (Reason: Close to the previous wave low, also near the EMA30 support level at 2959.73, with an integer threshold providing strong support)
- Buy Point 2: 2925 USDT (Reason: Further decline to near the December 27 opening price, an important support area, and close to the previous low of 2919.44)
- Long Stop Loss Point: 2910 USDT (Reason: 15 USDT below Buy Point 2, confirming support loss after breaking below the December 30 low of 2919.44)
- Sell Point 1: 3000 USDT (Reason: Significant psychological barrier at the integer level, close to recent hi
- Reward
- like
- Comment
- Repost
- Share
Today's liquidation direction, publicly available real-time positions.
View OriginalSubscribers Only
Subscribe now to view exclusive content- Reward
- 1
- 1
- Repost
- Share
DemonCultBrother-In-Law:
Merry Christmas, let's get bullish! 🐂Ethereum special session. Real-time quotes.
View OriginalSubscribers Only
Subscribe now to view exclusive content- Reward
- like
- 1
- Repost
- Share
JavsJr99 :
:
Yes yes