


Today’s Market Layout
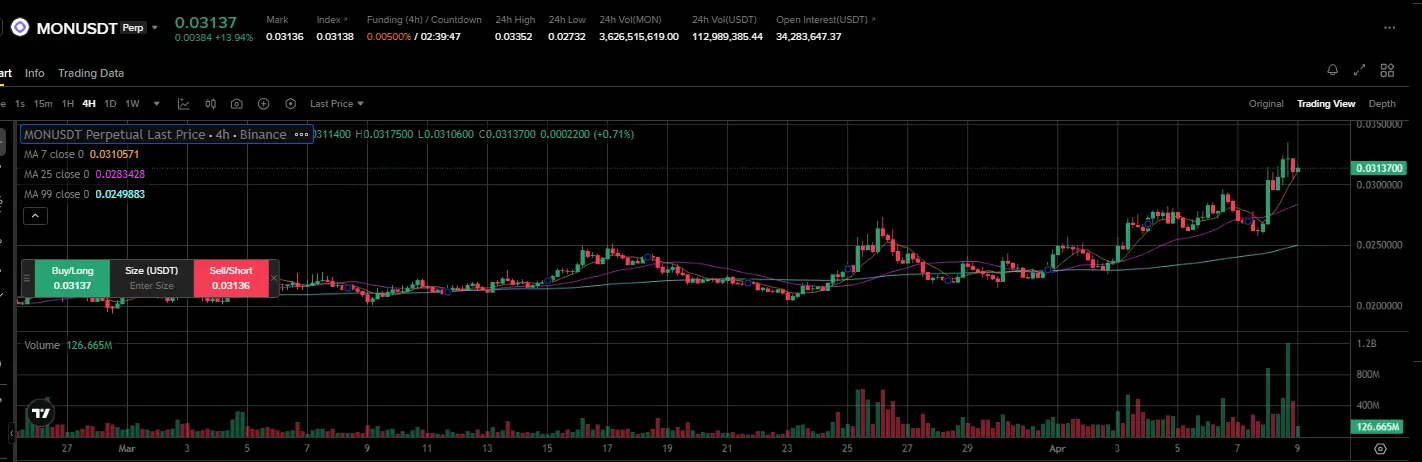
Figure 1 Order Book Imbalance Ribbon
Actually, over the past couple of days, just looking at the ribbon alone, it seems pretty easy to do... The market is operating along the side with relatively less resistance...
When the 72.7k insertion happened this morning, the 5% spot imbalance reached 4x.. (Sell order quantity is 4 times the buy order quantity) This is also a short-term signal and threshold...
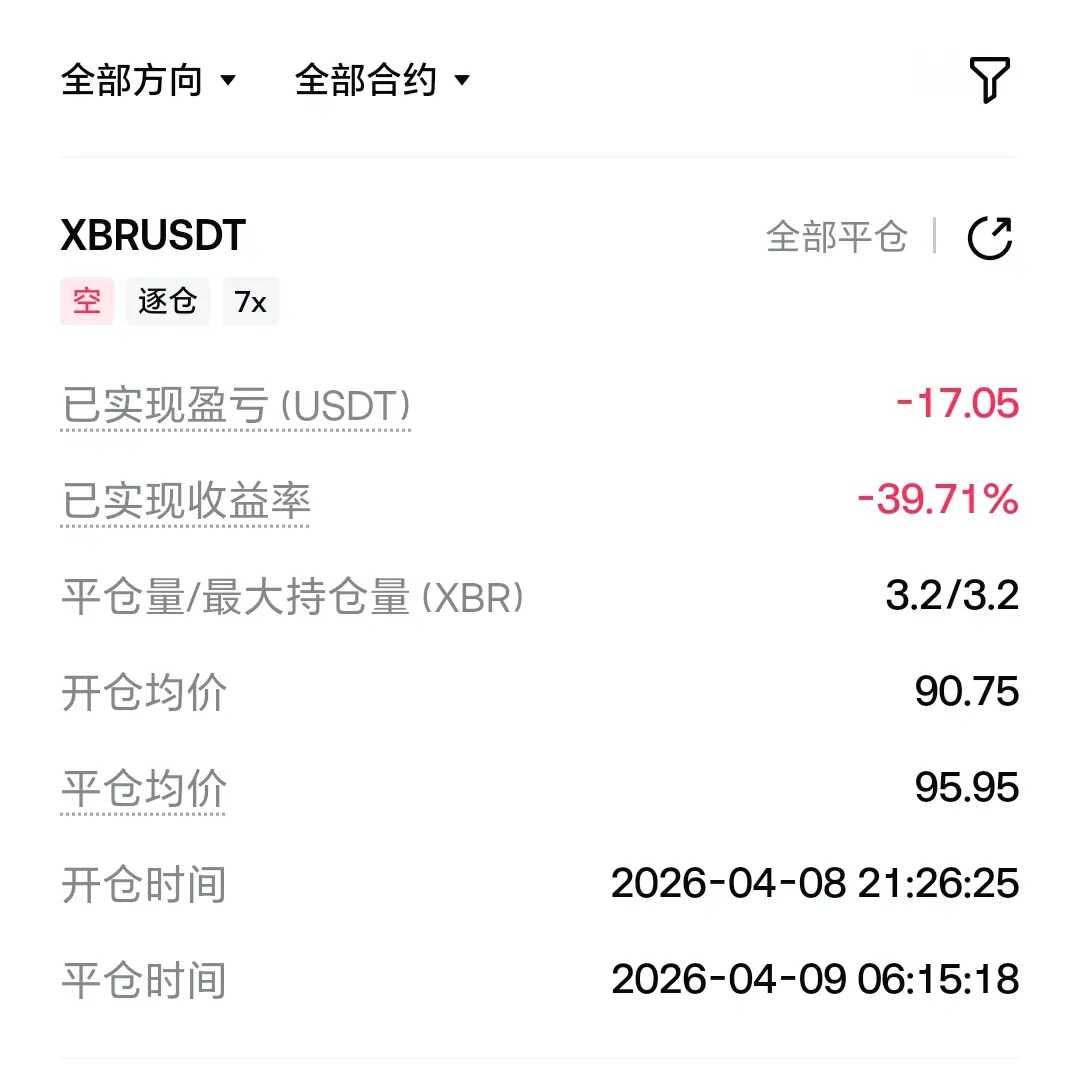
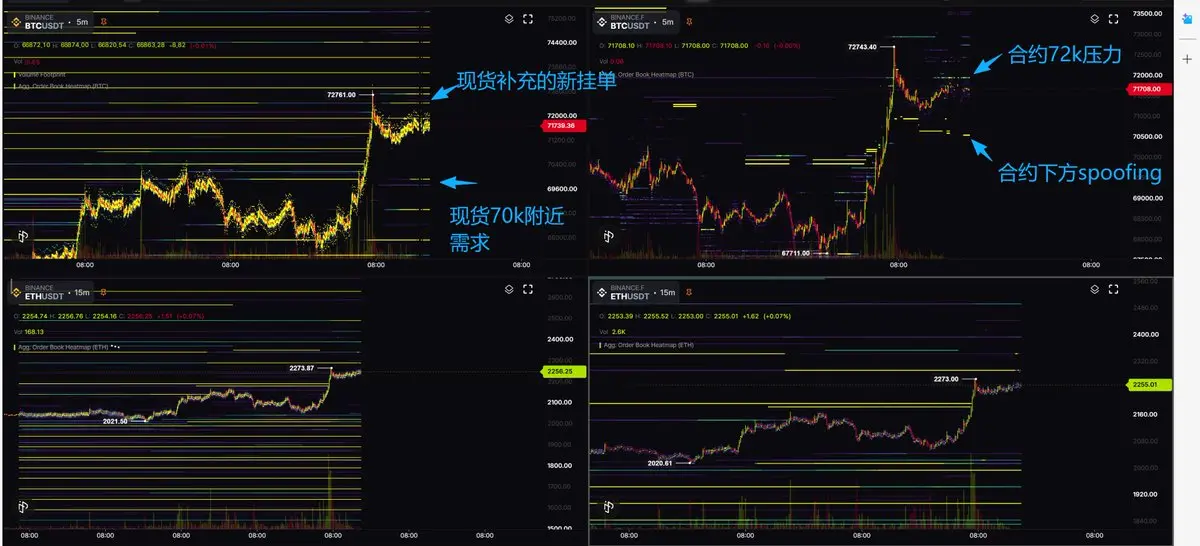
Figure 2 Order Book
What you see on the order book is consistent as well.. After the morning news drove a wave of inserted sell orders, during the sideways consolidation, sell orders near 72k on the spot market were replenished again, turning into new pressure..
Buy order demand is above 70k.
Small contract orders are pressing at 72k, suppressing the whole Asian session.. Down below, although there are large orders, it’s mostly spoofing.
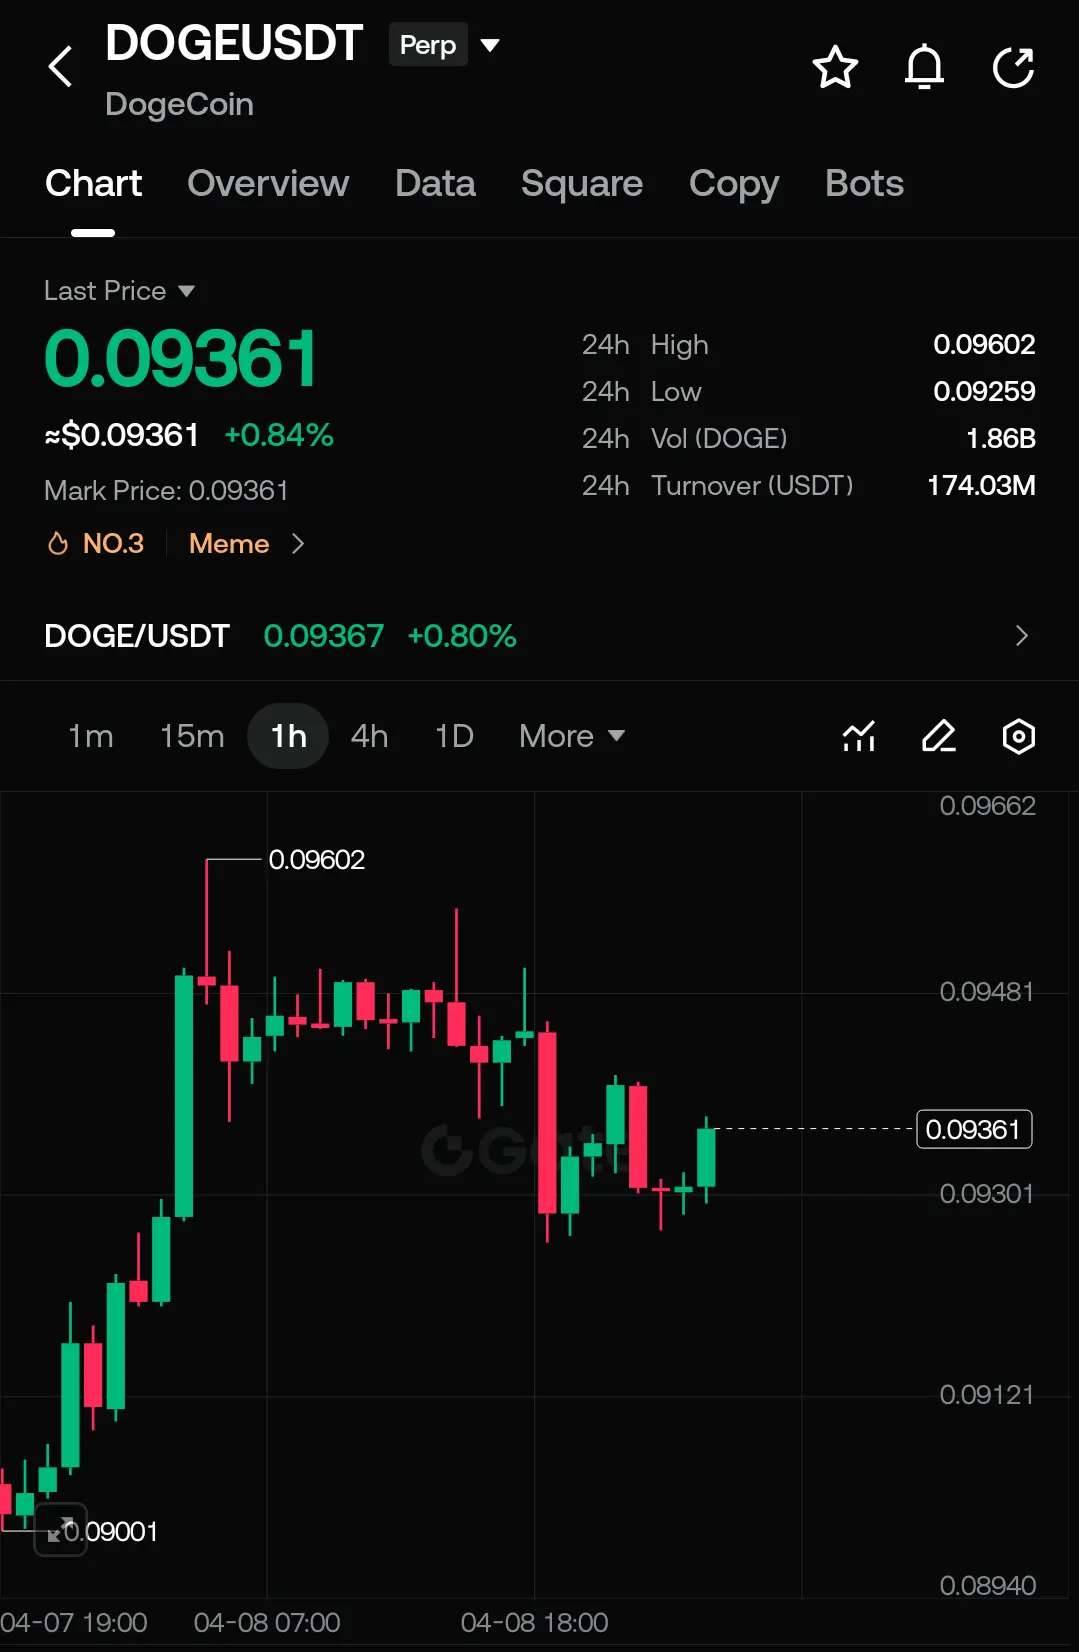
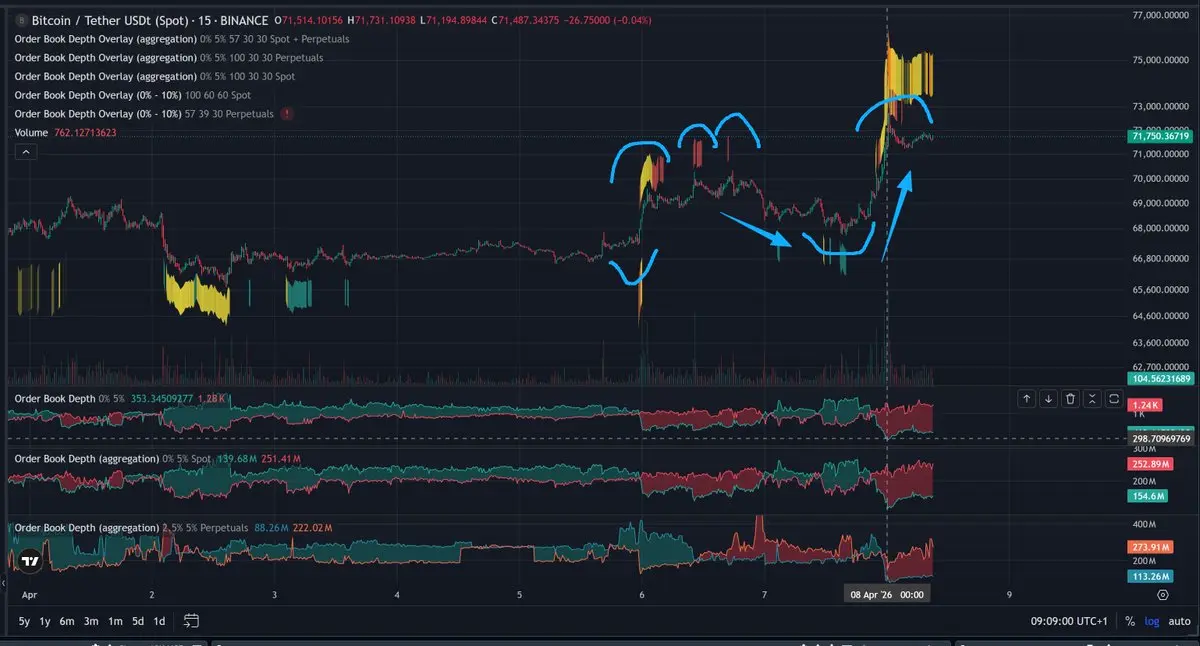
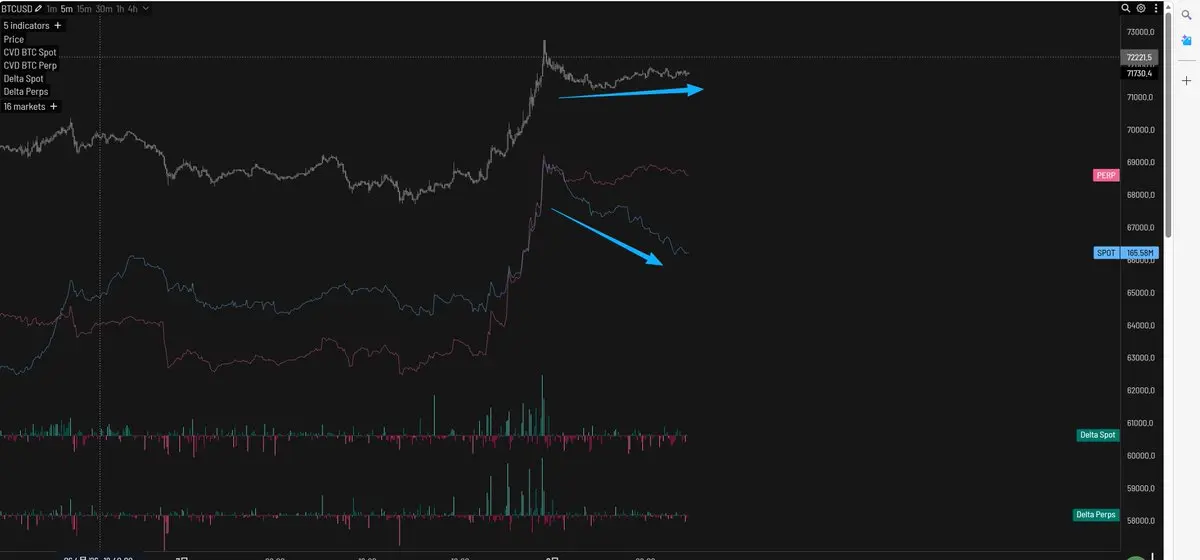
Figure 3 Funds Flow
From the CVD, throughout the Asian session, spot has been continuously selling off, but the price hasn’t gone down..
Even though it looks like there’s passive absorption..
But based on experience from the past 3-4 months, after a market like this appears, the probability of continuing to fill the gap downward is higher; the chance of pulling the second leg directly here is relatively smaller compared with this stretch of the recent bear market..
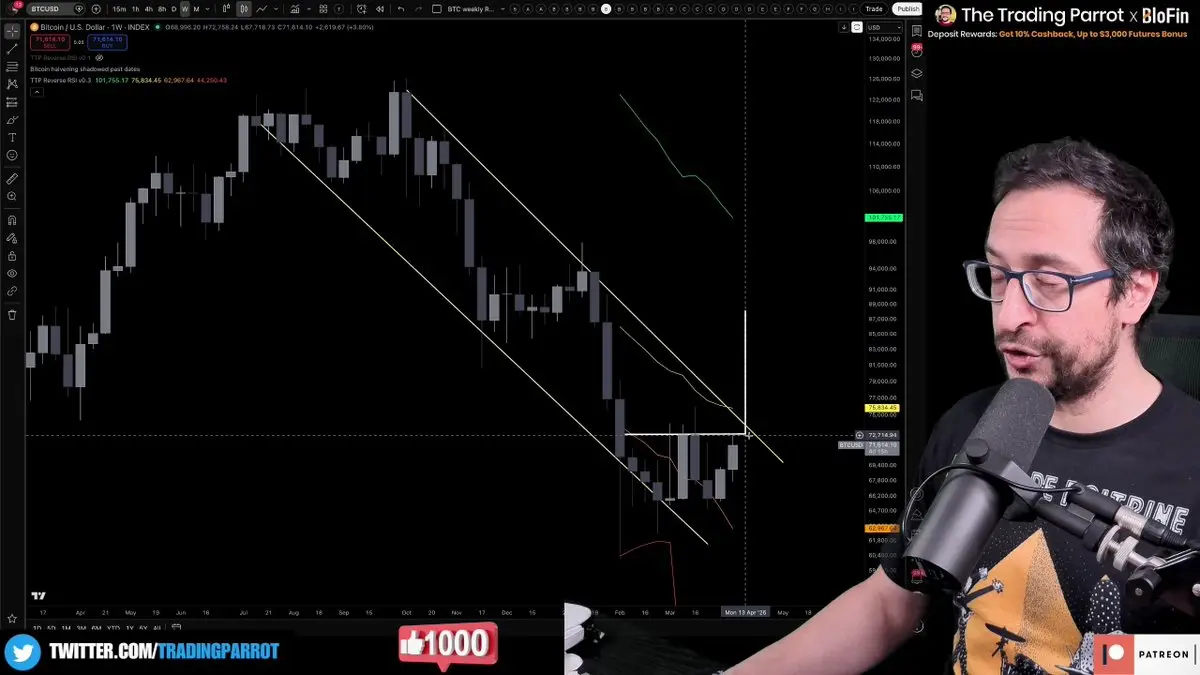
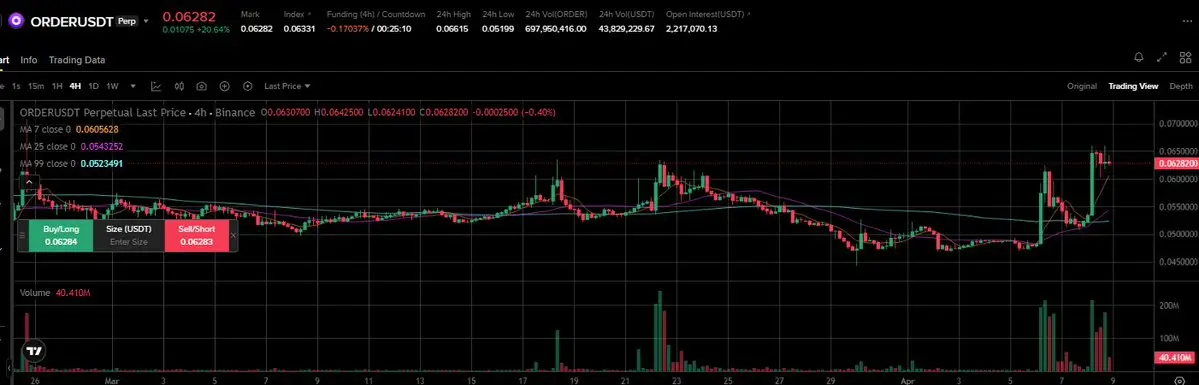
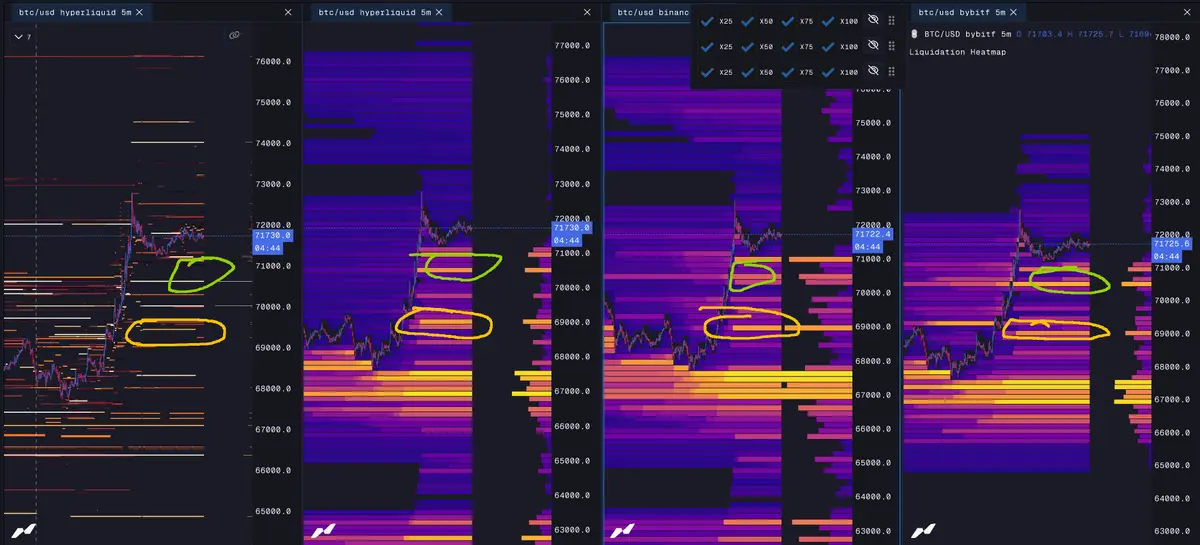
Figure 4 From stop-loss and liquidation liquidity
Green circles (above 70k) and yellow circles (around 69k)
Are two potential targets.. They are also the range to watch for whether a low-long entry model comes in and where to enter/exit..
-----------
So, combining everything, today’s low-long can look around 70k (liquidity + spot resting order demand + yesterday’s previous high) for price feedback...
If there aren’t a good opportunity, then wait and watch around 69k..
For taking shorts, there’s nothing but the Asian session’s previous high at 72.7k—either front-run, or potentially SFP (false breakout)
Go higher again? Around 74k there’s also another wave of the March 16-17 POC you can watch...
Figure 1 Order Book Imbalance Ribbon
Actually, over the past couple of days, just looking at the ribbon alone, it seems pretty easy to do... The market is operating along the side with relatively less resistance...
When the 72.7k insertion happened this morning, the 5% spot imbalance reached 4x.. (Sell order quantity is 4 times the buy order quantity) This is also a short-term signal and threshold...
Figure 2 Order Book
What you see on the order book is consistent as well.. After the morning news drove a wave of inserted sell orders, during the sideways consolidation, sell orders near 72k on the spot market were replenished again, turning into new pressure..
Buy order demand is above 70k.
Small contract orders are pressing at 72k, suppressing the whole Asian session.. Down below, although there are large orders, it’s mostly spoofing.
Figure 3 Funds Flow
From the CVD, throughout the Asian session, spot has been continuously selling off, but the price hasn’t gone down..
Even though it looks like there’s passive absorption..
But based on experience from the past 3-4 months, after a market like this appears, the probability of continuing to fill the gap downward is higher; the chance of pulling the second leg directly here is relatively smaller compared with this stretch of the recent bear market..
Figure 4 From stop-loss and liquidation liquidity
Green circles (above 70k) and yellow circles (around 69k)
Are two potential targets.. They are also the range to watch for whether a low-long entry model comes in and where to enter/exit..
-----------
So, combining everything, today’s low-long can look around 70k (liquidity + spot resting order demand + yesterday’s previous high) for price feedback...
If there aren’t a good opportunity, then wait and watch around 69k..
For taking shorts, there’s nothing but the Asian session’s previous high at 72.7k—either front-run, or potentially SFP (false breakout)
Go higher again? Around 74k there’s also another wave of the March 16-17 POC you can watch...