Bitcoin trading prices approach $86,000, but the market is facing the most adverse conditions since 2022. According to the “System Stress” report released by Checkonchain, investors are currently facing approximately $100 billion in unrealized losses, with about 60% of cash inflows into spot Bitcoin ETFs being in a loss position. Even more concerning, miners are reducing hash power, further destabilizing the paper house of Bitcoin ETFs.
$80,000 Becomes the Critical Threshold for Bitcoin ETF Capital
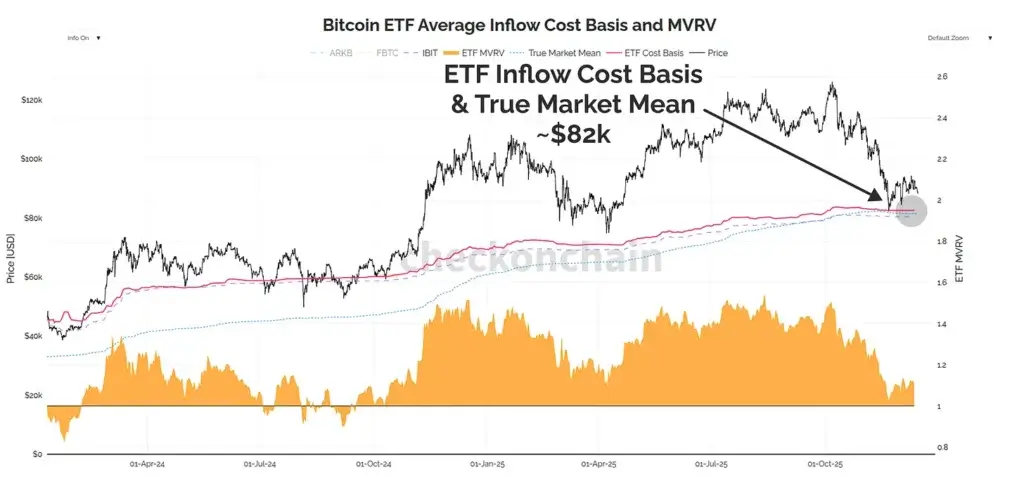
(Source: Checkonchain)
Checkonchain’s ETF average cost basis and ETF market cap versus realized value (MVRV) charts show that the ETF cost basis and real market mean are in the same zone, approximately between $80,000 and $82,000. This makes a large portion of institutional holdings close to break-even. These anchor points are important because they link price trends to asset liabilities.
When prices are at or below the total cost basis, realized losses may increase as participants unwind on price rebounds, and liquidity could wane. Glassnode, in its Week 49 on-chain report, states that Bitcoin has been fluctuating around a short-term cost basis close to $102,700 and a true market mean near $81,300. It defines $95,000 (the cost basis’s 0.75 quantile) as the early recovery level.
Bitwise also considers the true market average around $82,000 as a support reference point and describes a support channel from approximately $82,000 to $75,000, linking this zone with IBIT’s cost basis (around $81,000) and MicroStrategy (MSTR)’s cost basis (close to $75,000). Bitwise estimates that after about a 35% price drop, unrealized losses amount to approximately $152 billion (about 6.6% of market cap).
Five Critical Price Defense Lines and Their Significance
$102,700: Short-term holding cost basis, a breach would trigger widespread profit-taking
$95,000: 0.75 cost basis quantile, a psychological level indicating early recovery
$81,000 to $82,000: True market average and ETF inflow cost basis cluster, the most critical defense line
$75,000: Support channel lower bound (MSTR cost basis reference), breaking below would trigger a chain reaction
$65,000 to $70,000: ETF capital concentration zone, holding 15.2% of ETF capital
The stress feature refers to Bitcoin ETF capital amounts between $75,000 and $85,000. However, only 2.9% of funds are in the $75,000 to $85,000 range. If prices fall below the central zone, buffer space becomes thinner. Amberdata also describes a more concentrated “fortress” zone between $65,000 and $70,000. If the market breaks through the gap at $75,000 to $85,000, this distribution could lead to a faster decline.
Tripartite Pressure Tears Market Structure
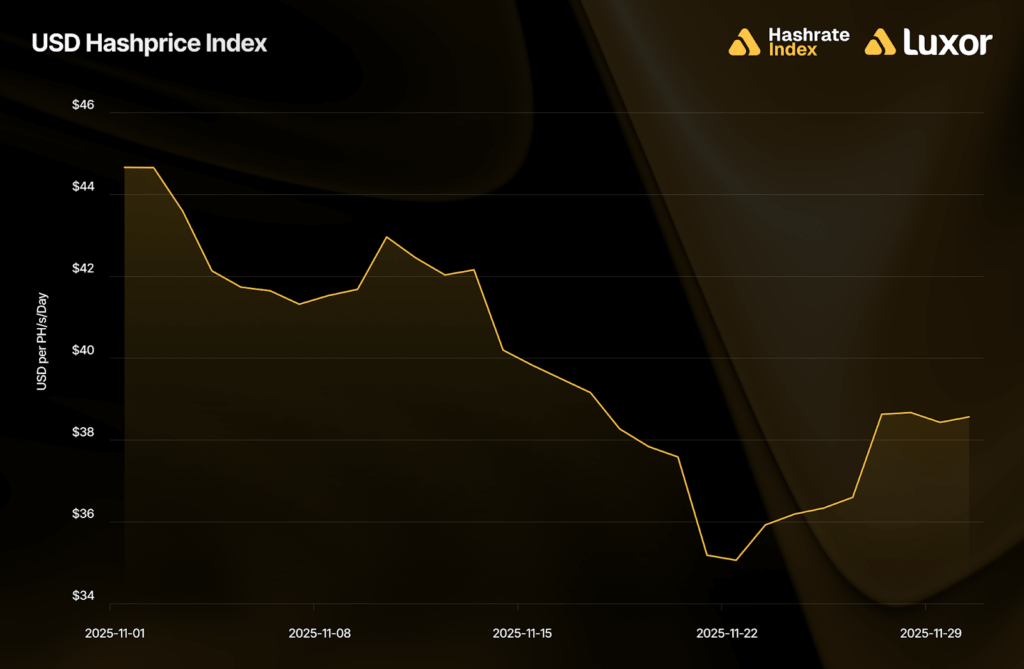
(Source: Luxor)
The fragility of the Bitcoin ETF paper house is driven not only by cost basis issues but also by resonant pressure from the ETF, miners, and sovereign bonds companies. According to Bitbo’s ETF tracker, as of December 15, the US spot Bitcoin ETF holds about 1,311,862 BTC (roughly $117.3 billion). After alternating inflows and outflows over the past two weeks, BlackRock’s IBIT holds about 778,052 BTC (roughly $69.6 billion).
Even if prices rebound, realized losses are already high. Glassnode reports that the net realized loss (30-day simple moving average) approaches $555 million daily, the highest since the FTX liquidation era. The report states that even if prices bounce from late November lows above $90,000, the situation remains precarious.
Miner pressure further exacerbates the instability of this Bitcoin ETF paper house. Luxor’s hash rate index review in November indicates the dollar hash rate price averaged about $39.82, down 17.9% quarter-over-quarter. On November 22, the price hit a historic low near $35.06. Luxor notes that the forward curve from December 2025 to April 2026 has fallen about 16% to 18% in USD terms. Checkonchain also reports that miners are reducing hash power, raising concerns about a capitulation sell-off.
A third asset class, Bitcoin sovereign bonds, is also facing capital restrictions. Reuters reports that Bitcoin asset managers purchased about $50 billion worth of Bitcoin over the past year, but many Bitcoin trades are now below their net asset value. This diminishes the advantage of issuing shares to buy more Bitcoin. When these stocks trade below the value of their holdings, the “issue stock, buy Bitcoin” flywheel effect cannot operate at scale.
Macroeconomic Linkages Amplify the Crisis
Reuters cites data from the London Stock Exchange Group (LSEG), showing that by 2025, the average correlation between Bitcoin and the S&P 500 approaches 0.5, up from about 0.29 in 2024. The report also indicates that the correlation with the Nasdaq 100 is close to 0.52, up from approximately 0.23 in 2024, suggesting many of the declines are linked to stock risk mechanisms.
In this context, interest rates are crucial as they determine market risk appetite. Bank of America expects two more rate cuts in June and July 2026, keeping the 2026 interest rate path a focal point for risk assets. It is this causal relationship that leads Checkonchain to describe the current situation as the most adverse since 2022.
Disclaimer: The information on this page may come from third parties and does not represent the views or opinions of Gate. The content displayed on this page is for reference only and does not constitute any financial, investment, or legal advice. Gate does not guarantee the accuracy or completeness of the information and shall not be liable for any losses arising from the use of this information. Virtual asset investments carry high risks and are subject to significant price volatility. You may lose all of your invested principal. Please fully understand the relevant risks and make prudent decisions based on your own financial situation and risk tolerance. For details, please refer to
Disclaimer.
Related Articles
Wintermute: Energy is building in the crypto market, but the direction is unclear—there may be a sudden surge in trading activity.
Wintermute says the easing window for the situation is coming to an end. The cap on risk assets is lower than before, making it difficult for Bitcoin to stay above $700,000. If diplomatic progress goes smoothly and oil prices pull back, Bitcoin could rebound to $70,000–$74,000; if conditions deteriorate, it could fall to $60,000, or even to $50,000–$55,000. The extent of market volatility may exceed current pricing.
GateNews8m ago
Bitcoin Breaks Crucial Neckline Area of Bullish Pattern, Analysts Prepare for $50,000 BTC Prices
Bitcoin breaks crucial neckline area of bullish pattern.
This has sent analysts into a bearish frenzy, expecting lower prices.
The price of BTC is expected to hit targets between $48,000 and $55,000 next.
The crypto community continues to watch price charts closely to determine what
CryptoNewsLand39m ago
We Asked 2 AIs: What Must XRP Do to Escape the Ongoing Crisis?
Alongside the rest of the crypto market, Ripple’s cross-border token tried to break out in the middle of the business week, surging to a monthly peak of over $1.60. However, the subsequent rejection pushed it south to under $1.50 as of press time.
Even the most recent developments on the Ripple
CryptoPotato40m ago
Bearish sentiment builds in crypto as volatility and hedging rise
The crypto market exhibited signs of volatility on Tuesday, with bitcoin BTC$66,223.90 spiking to $68,300 shortly after midnight UTC before tumbling back to $66,500.
The initial spike was spurred by reports that U.S. President Donald Trump was willing to end the war in Iran without the Strait of
CoinDesk1h ago
Stablecoins grow faster than expected as more new applications emerge
Stablecoin is experiencing faster growth than expected, driven by new applications like AI payments. However, Standard Chartered maintains its forecast of a $2 trillion market cap by 2028.
TapChiBitcoin1h ago
PI Network (PI) Price Predictions for This Week
PI Network's price has corrected from $0.30 to $0.17, indicating a 40% drop. Currently, it hovers around $0.18, presenting a bearish outlook unless it surpasses $0.20. Volume remains low, suggesting indecision among sellers, while the RSI stays under 50, signaling further potential declines.
CryptoPotato1h ago
