Stellar (XLM) extends its losing streak to the seventh consecutive session, losing more than 1% as of Tuesday. The cryptocurrency, often seen as a direct competitor to Ripple (XRP), is showing clear signs of weakening demand from retail investors, as short positions on the XLM derivatives market continue to increase. From a technical perspective, selling pressure remains dominant, pushing XLM close to the April lows and increasing the risk of breaking the key psychological support level at $0.2000.
XLM Derivatives Market Signals a Downward Trend
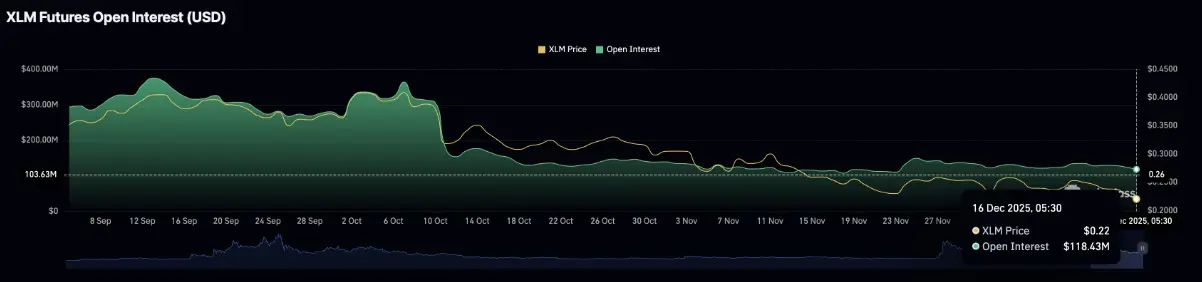
Data from CoinGlass shows that the XLM futures market is weakening significantly as open interest (OI) drops to $118.43 million, considerably lower than the $124.72 million recorded on Monday. This development reflects a narrowing of the nominal value of XLM futures — meaning the total value of all open positions, including leveraged longs and shorts — indicating that speculative capital is gradually withdrawing from the market.
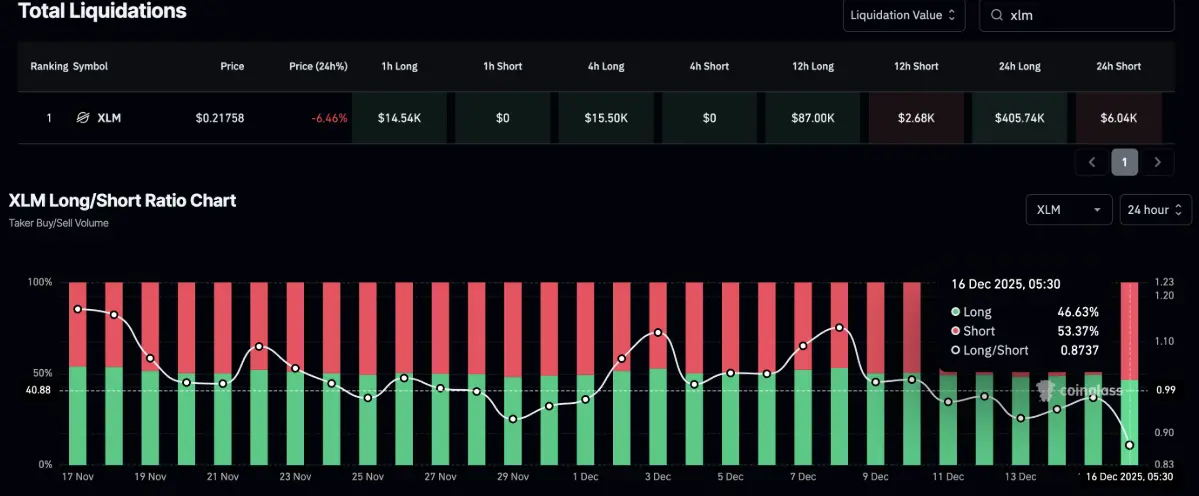
 Unsettled XLM Futures Contract Volume | Source: CoinGlassIn the context of declining investor risk appetite, selling pressure has become overwhelming as the total value of long (Long) positions liquidated in the past 24 hours reached $406,740, many times higher than the $6,040 in short (Short) liquidations. The strong wave of long position liquidations quickly shifted the market balance, giving the bears the upper hand. This is clearly reflected in the Long/Short ratio, with short positions increasing to 53.37% on Tuesday from 50.57% in the previous 24 hours, reinforcing the bearish signal dominating the XLM derivatives market.
 XLM Derivatives Data | Source: CoinGlass## Stellar’s Plunge Threatens Key Psychological Support Level
Stellar continues its decline, closing Monday’s session at $0.2205 — the lowest since early 2025. Persistent selling pressure is pushing XLM toward an important support zone around $0.2001, coinciding with the bottom established on April 7.
In a negative scenario, if this cross-border payment token breaks below the aforementioned support, the price is likely to retreat further to the Pivot S2 level at $0.1642, before facing a critical test at the year’s bottom around $0.1600.
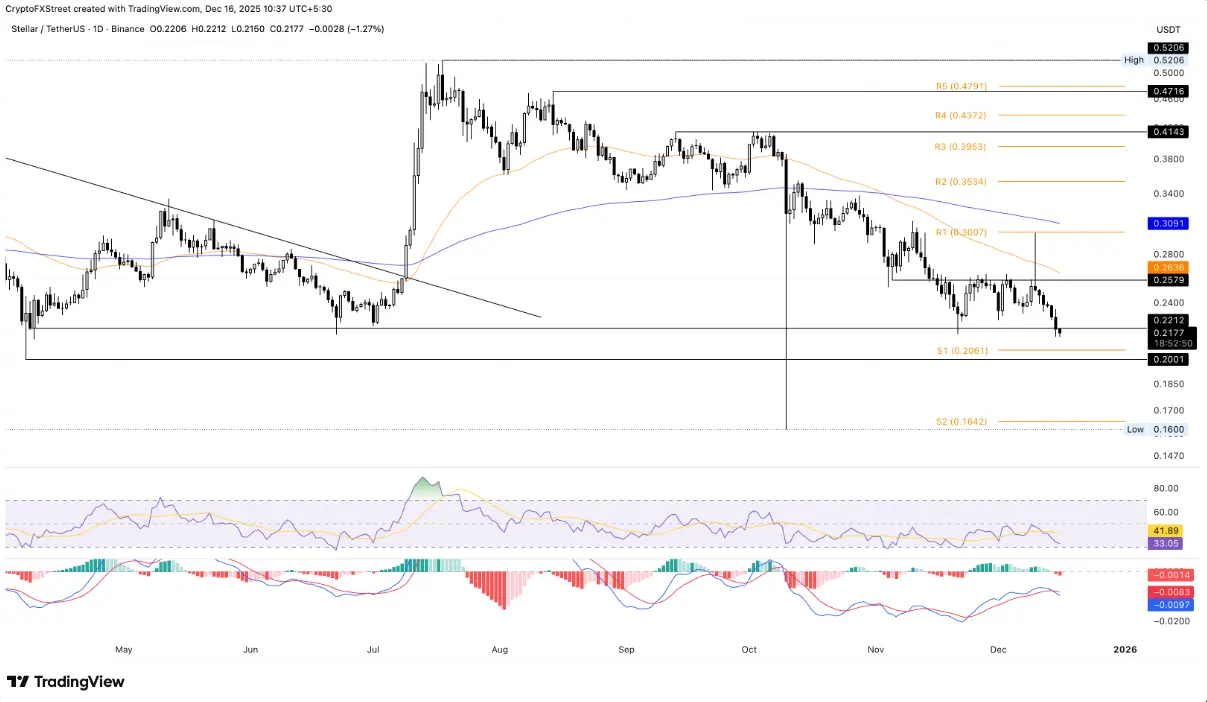 Daily XLM/USDT Chart | Source: TradingViewFrom a technical standpoint, downside risks remain dominant as momentum indicators on the daily timeframe all signal weakening. The RSI is currently oscillating around 33, approaching oversold territory, while the MACD continues to widen its downward momentum after crossing below the signal line — indicating that the bearish trend has yet to show signs of reversal.
Conversely, if XLM experiences a strong technical rebound, the current bearish structure could be challenged, opening the way for the price to retest the $0.2579 zone. This is the intraday low on November 5, which has repeatedly served as a significant barrier to recovery efforts in late November and early December.
Disclaimer: The information on this page may come from third parties and does not represent the views or opinions of Gate. The content displayed on this page is for reference only and does not constitute any financial, investment, or legal advice. Gate does not guarantee the accuracy or completeness of the information and shall not be liable for any losses arising from the use of this information. Virtual asset investments carry high risks and are subject to significant price volatility. You may lose all of your invested principal. Please fully understand the relevant risks and make prudent decisions based on your own financial situation and risk tolerance. For details, please refer to
Disclaimer.
Related Articles
Cardano’s Chart Just Printed a “Black 9” – Here’s Where ADA Price Could Go Next
Ali Martinez highlights a significant technical signal for Cardano, specifically the TD Sequential indicator showing a "black 9," suggesting a potential price reversal after a prolonged downtrend. If ADA maintains support at $0.23, it could rise to $0.32 and $0.37. However, failure to hold this level might invalidate the bullish setup.
CaptainAltcoin7m ago
Market Experts Insist Funds Won't Flow from Gold to Bitcoin, BTC Pullback Synchronizes with XAU
Market expert Benjamin Cowen stated that Bitcoin is unlikely to attract capital inflows due to a gold price pullback. Bitcoin and gold prices show high correlation in volatility, with Bitcoin recently declining from $76,000 to $70,000, while gold plummeted 8.54%. Although Bitcoin's price performance against gold demonstrates resilience, Cowen pointed out that market rotation has not yet occurred, and investors need to monitor Bitcoin's support levels to assess risks.
GateNews10m ago
Six Countries Unite to Stabilize Energy Market, Oil Prices Fall Nearly 2%, Bitcoin Rebounds to $70,800
On March 20, a multi-country coordinated action stabilized the energy market, oil prices fell, and Bitcoin rebounded to $70,800 at one point, gaining over 1% for the day. Mainstream coins such as Ethereum and XRP rose less than 1%. Market uncertainty remains, stock market momentum has shifted to bearish, which could impact financial markets.
GateNews19m ago
Bitcoin Shows Resilience Amid Oil Boom Impact, $70,000 Key Support Level Becomes Rebound Focus
Bitcoin demonstrates resilience amid global market volatility, outperforming most assets despite recent declines exceeding 3%. Analysts point out that the support zone of 69,000 to 70,000 USD is crucial for future price movements, and holding this level could trigger a rebound. Overall, Bitcoin exhibits clear safe-haven characteristics against the backdrop of geopolitical tensions and soaring oil prices.
GateNews22m ago
STRC Current Value Reveals MSTR Risk: Bitcoin Accumulation Commitment May Fall Short
Strategy's dividend preferred stock Stretch (STRC) may be overvalued due to its high annualized dividend yield of 11.5% and significantly increased future payment obligations. While it may improve the balance sheet in the short term, if Bitcoin's appreciation fails to exceed the high dividend yield, common shareholders' returns will be limited, and the market remains cautious about STRC's long-term sustainability.
GateNews24m ago
XRP Meme Coins Become "Invisible Accumulation Tools"? Analysis of New XRPL Strategies and Risks
As XRPL ecosystem activity increases, XRP meme coins have become a new pathway for some traders to increase their XRP holdings. The current meme coin market cap is approximately $50 million, attracting speculative capital attention. Through AMM pools trading with XRP, traders can achieve "passive accumulation." The overall market cap is approximately $418 million, with meme coins showing significant volatility, but liquidity and market attention remain limited. In the short term, they should be viewed as trading tools with both risks and rewards.
GateNews24m ago
