Date: Fri, Dec 19 2025 | 12:15 PM GMT
The broader cryptocurrency market has been showing relative strength despite concerns around the Japan rate hike, while easing U.S. inflation has helped both Bitcoin (BTC) and Ethereum (ETH) remain in the green. Against this backdrop, Bitcoin Cash (BCH) has quietly moved into the spotlight, posting a notable upside move.
BCH has climbed nearly 9% recently, but the bigger story appears to be unfolding on the chart itself. Price action is now forming a structure that often precedes larger trend reversals, suggesting that the recent rally may be more than just a short-term bounce.
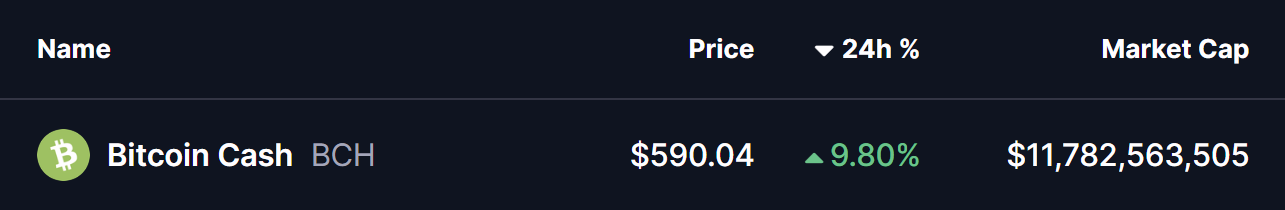
Source: Coinmarketcap
Rounding Bottom in Play?
On the daily timeframe, Bitcoin Cash appears to be carving out a rounding bottom formation — a classic bullish reversal pattern that reflects a gradual shift from distribution to accumulation. This pattern typically develops after a prolonged correction, as selling pressure fades and buyers slowly regain control.
The setup began after BCH faced a firm rejection near the $630 region in September 2025. That rejection triggered a sharp decline, dragging price down toward the $446.9 area. Importantly, sellers failed to push price significantly lower from there, and strong demand emerged at those levels. Over time, BCH stabilized, volatility compressed, and price began to curl higher, completing the rounded base structure.
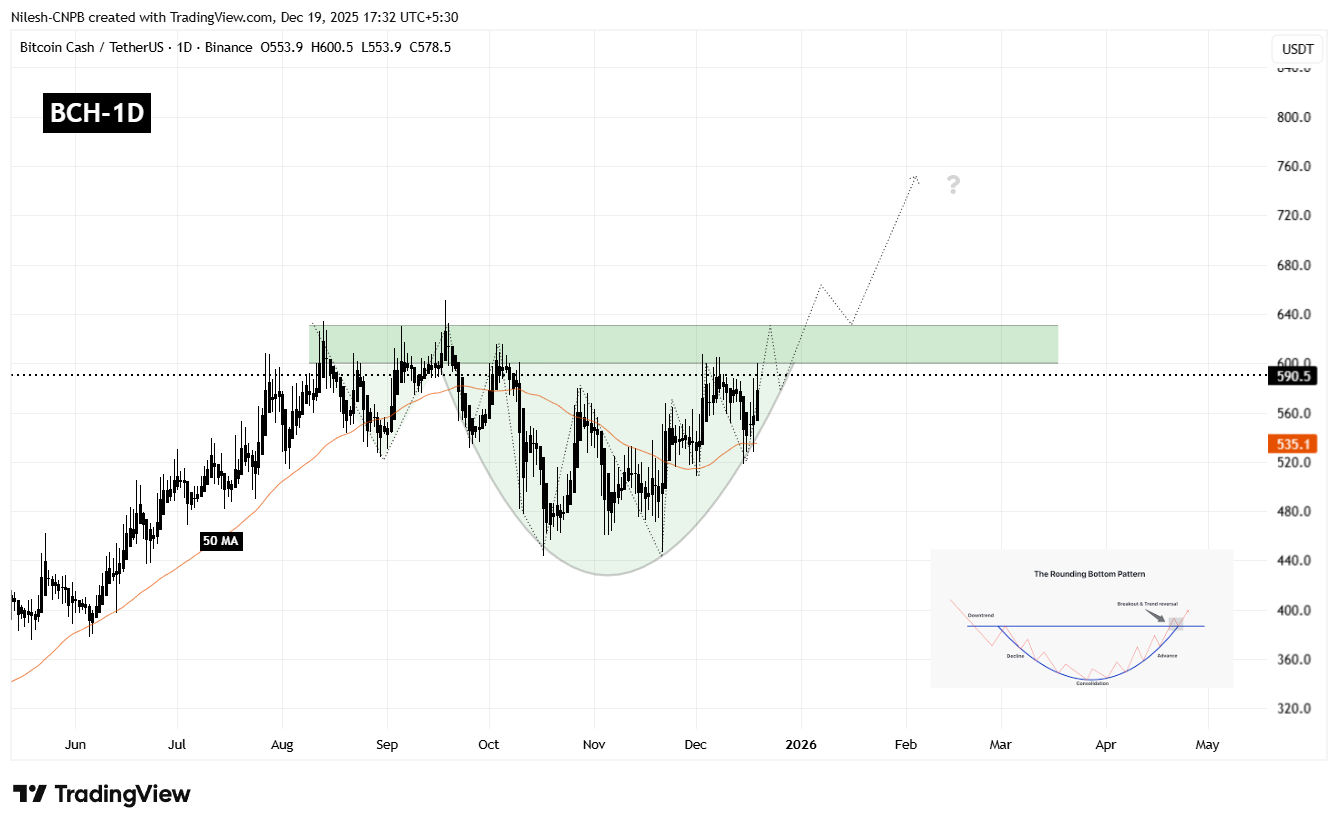
Bitcoin Cash (BCH) Daily Chart/Coinsprobe (Source: Tradingview)
Currently, BCH is trading around the $590 mark and pressing up against a well-defined resistance zone between $600 and $630. This area represents the neckline of the rounding bottom pattern and has capped price advances multiple times in the past, making it the most critical level to watch in the near term.
What’s Next for BCH?
A clean daily close above the $600–$630 resistance zone would confirm the bullish rounding bottom breakout. If that breakout is followed by a successful retest of the same zone as support, it would significantly strengthen the bullish case and suggest that a new upward leg is underway.
Based on the depth of the rounding structure, the projected upside target points toward the $800–$820 region. Reaching that zone would imply a potential upside of roughly 35–40% from current levels, aligning with the measured move typically associated with this pattern.
However, patience remains important. Before any confirmed breakout, BCH could still experience short-term pullbacks, including a dip toward the rising base of the rounding structure or the 50-day moving average, which has been acting as dynamic support during the recovery. Such pullbacks would not necessarily invalidate the bullish setup, as long as price continues to hold above the higher low structure.
Until a decisive breakout and retest occur, traders may want to remain cautious and avoid chasing price. The $600–$630 zone remains the line in the sand that will determine whether BCH transitions into a sustained bullish phase or remains range-bound for longer.
Disclaimer: The views and analysis presented in this article are for informational purposes only and reflect the author’s perspective, not financial advice. Technical patterns and indicators discussed are subject to market volatility and may or may not yield the anticipated results. Investors are advised to exercise caution, conduct independent research, and make decisions aligned with their individual risk tolerance.
Disclaimer: The information on this page may come from third parties and does not represent the views or opinions of Gate. The content displayed on this page is for reference only and does not constitute any financial, investment, or legal advice. Gate does not guarantee the accuracy or completeness of the information and shall not be liable for any losses arising from the use of this information. Virtual asset investments carry high risks and are subject to significant price volatility. You may lose all of your invested principal. Please fully understand the relevant risks and make prudent decisions based on your own financial situation and risk tolerance. For details, please refer to
Disclaimer.
Related Articles
Major CEX and DEX funding rates fully turned negative, BTC down 1.93%, ETH down 2.18%
On March 22, Bitcoin reported $69,275.33, down 1.93% in 24 hours; Ethereum reported $2,103.95, down 2.18%. The market is broadly bearish, with shorts dominating. Funding rates are universally negative, indicating that shorts need to pay fees to longs.
GateNews1m ago
Polymarket predicts that the probability of Bitcoin falling to $65,000 in March has increased to 49%.
Gate News, on March 22, as Bitcoin briefly dropped below $69,000, the prediction probability of "Bitcoin falls to $65,000 in March" on the Polymarket prediction market rose to 49%. Additionally, the probability of predicting Bitcoin falling to $60,000 is 16%, and the probability of predicting it rising to $80,000 is 12%.
GateNews38m ago
Bitcoin Options Signal Concern Even as ETF Outflows Remain Relatively Low
Bitcoin price (BTC) maintained a sideways trend around the 70,000 USD level during Friday's trading session, after failing to reclaim the previous 75,000 USD milestone. This movement coincides with two consecutive sessions recording net capital outflows from U.S. spot Bitcoin ETF funds, thereby reversing the trend.
TapChiBitcoin44m ago
Bitcoin Mining Difficulty Adjusts Down 7.76% to 133.79T, Creating Second-Largest Decline This Year
Bitcoin mining difficulty declined by 7.76% to 133.79 T on March 21, marking the second-largest drop this year. JPMorgan Chase analysts forecast that Bitcoin mining costs have fallen to $77,000, still above spot prices. An increasing number of mining companies are redirecting infrastructure toward AI computing power. Core Scientific plans to sell its Bitcoin holdings in 2026 to fund AI expansion, while Bitdeer has liquidated its Bitcoin position. Multiple companies are formulating diversification strategies.
GateNews56m ago
Why JPMorgan's $266K Bitcoin Target Makes Sense as Institutional Demand Strengthens, Expert Insight
JPMorgan’s $266,000 bitcoin projection is being interpreted as a strategic signal to institutions, revealing how bank-grade research is shaping allocation behavior rather than simply forecasting price direction.
JPMorgan’s $266K Bitcoin Target Holds up Under Expert Market Scrutiny
Market
Coinpedia1h ago
