Date: Tue, Dec 23, 2025 | 06:01 PM GMT
The broader cryptocurrency market has remained under pressure over the past several weeks, with the ongoing corrective phase weighing heavily on overall altcoin sentiment. Monad (MON) has also felt the impact of this weakness, as persistent selling pressure has kept price action subdued and volatile.
MON has declined by nearly 32% over the past 30 days, yet a closer look at the chart suggests that the current structure may be more constructive than it appears at first glance. Interestingly, Monad’s recent price behavior is beginning to resemble a bottoming pattern that previously played out on Hyperliquid (HYPE), a setup that eventually led to a powerful upside reversal earlier this year.
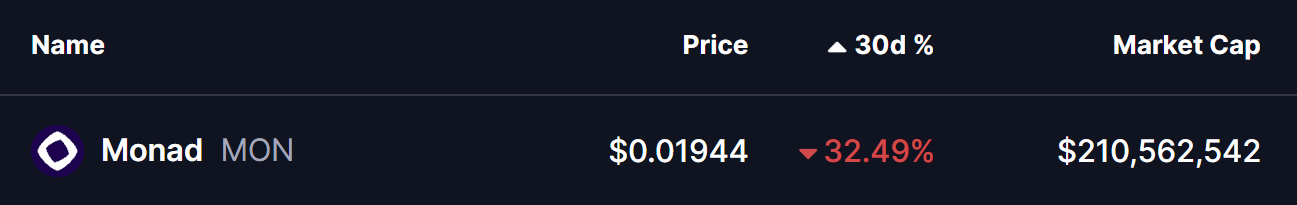
Source: Coinmarketcap
MON Mirrors HYPE’s Fractal Structure
On the comparative charts, MON appears to be tracing a structure strikingly similar to HYPE’s April 2025 fractal. In HYPE’s case, the token endured a deep 73% correction from its all-time high before forming a broadening wedge structure near the bottom. That consolidation phase ultimately resolved to the upside, with price reclaiming its key moving average and triggering a rally of more than 160% in the weeks that followed.
Monad’s decline from its own all-time high has reached roughly 65%, placing it well within the range of historical washout zones often associated with trend exhaustion. The current setup shows MON compressing within a symmetrical broadening wedge, a pattern that frequently precedes strong directional moves once price escapes the structure.
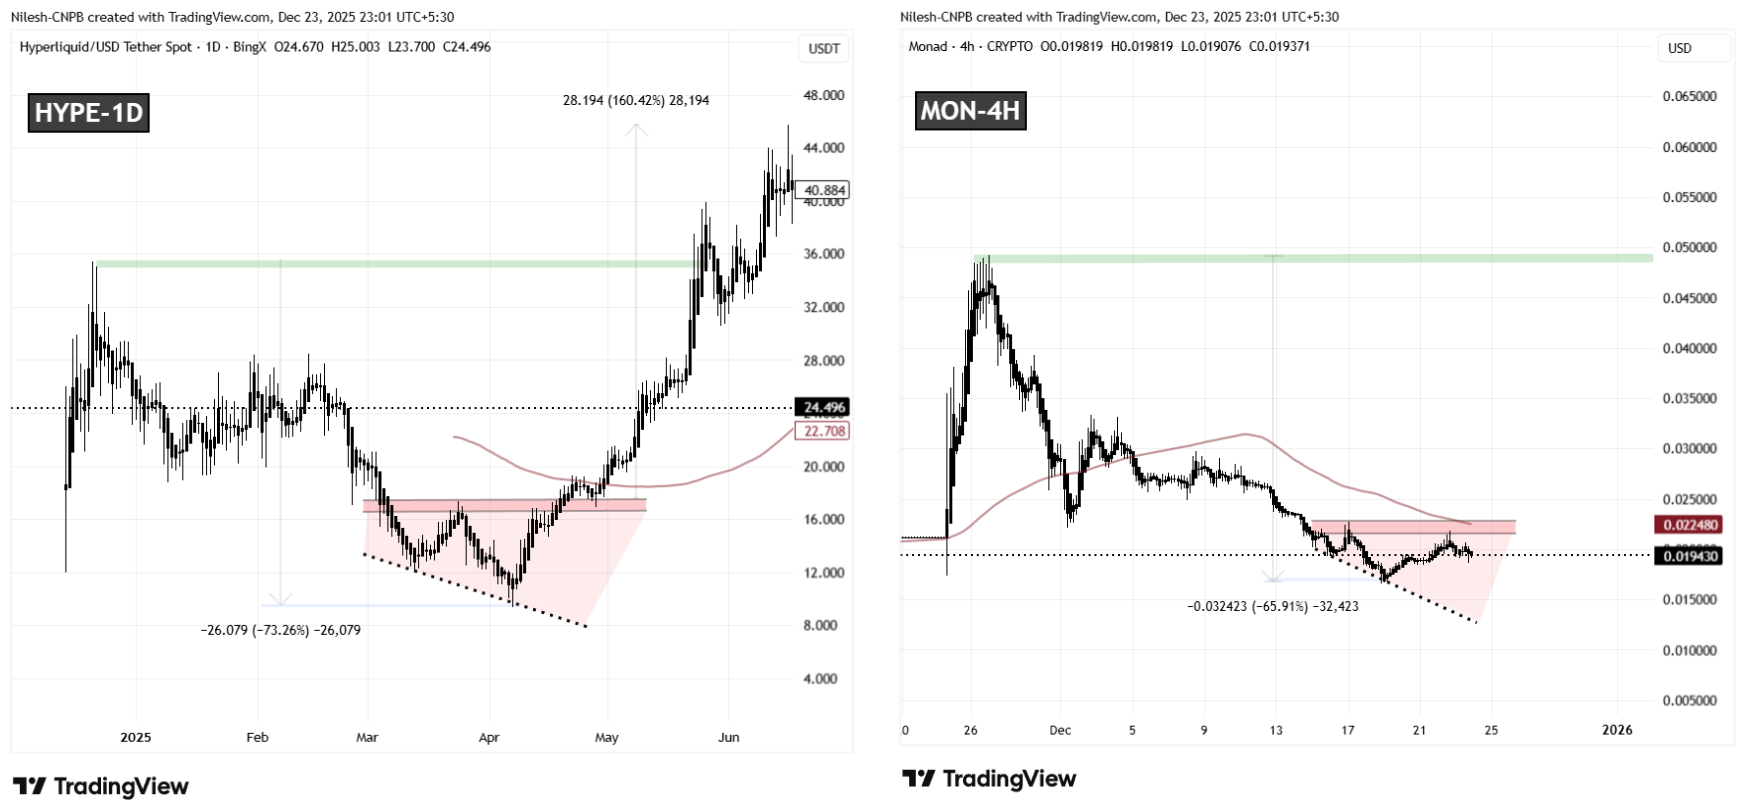
HYPE and MON Fractal Chart/Coinsprobe (Source: Tradingview)
This similarity becomes more compelling when viewed alongside the price behavior around resistance. MON is currently hovering just below a key neckline resistance band between $0.02170 and $0.02268, an area that closely mirrors the zone where HYPE consolidated before its breakout. The alignment between these two structures suggests that MON may be approaching a decision point.
What’s Next for MON?
Despite the growing resemblance to HYPE’s pre-breakout phase, the technical picture has not yet fully shifted in favor of the bulls. Sellers still retain short-term control, and confirmation is needed before a bullish reversal can be considered valid.
For momentum to flip decisively, MON would need to break above the upper boundary of the wedge and reclaim its 100 moving average, which sits near the $0.02248 level. A successful move above this region would signal improving trend strength and increase the probability that the fractal analogy continues to play out.
If such a breakout occurs, the upside potential becomes notable. A sustained bullish reversal could open the door for a broader recovery move toward the $0.049 area, which aligns with MON’s previous all-time high and represents roughly 155% upside from current levels. Until then, price action around resistance will remain critical in determining whether this fractal setup evolves into a full-fledged trend reversal or fails under continued market pressure.
**Disclaimer: **The views and analysis presented in this article are for informational purposes only and reflect the author’s perspective, not financial advice. Technical patterns and indicators discussed are subject to market volatility and may or may not yield the anticipated results. Investors are advised to exercise caution, conduct independent research, and make decisions aligned with their individual risk tolerance.
Disclaimer: The information on this page may come from third parties and does not represent the views or opinions of Gate. The content displayed on this page is for reference only and does not constitute any financial, investment, or legal advice. Gate does not guarantee the accuracy or completeness of the information and shall not be liable for any losses arising from the use of this information. Virtual asset investments carry high risks and are subject to significant price volatility. You may lose all of your invested principal. Please fully understand the relevant risks and make prudent decisions based on your own financial situation and risk tolerance. For details, please refer to
Disclaimer.
Related Articles
CryptoQuant: Ethereum Faces "Adoption Paradox," ETH Could Drop to $1,500
Ethereum is facing an "adoption paradox," with network activity reaching all-time highs while ETH price has declined significantly. CryptoQuant analysis indicates that if the bear market persists, ETH could fall to $1,500. The relationship between exchange inflows and price dynamics is more pronounced, suggesting ETH is facing strong selling pressure.
GateNews29m ago
Today's cryptocurrency Fear and Greed Index dropped to 15, with the market still in extreme panic mode
Gate News: On March 13, according to Alternative.me data, the Cryptocurrency Fear and Greed Index fell to 15 today, down further from yesterday's 18, with the market still in an "extreme fear state."
GateNews33m ago
ETH 15-minute increase of 0.79%: Liquidity phase decline and short-term fund arbitrage resonance driving upward momentum
March 13, 2026, 00:00 to 00:15 (UTC), Ethereum (ETH) experienced a significant upward price movement in a short timeframe, with the 15-minute interval return reaching +0.79%. The price range was 2070.45 to 2090.33 USDT, with a volatility amplitude of 0.96%. Market fluctuations intensified during this period, capturing traders' attention.
The primary driver of this price movement was a phase-wise decline in market liquidity. During this period, there were no on-chain large transfers, DeFi liquidations, or significant derivatives liquidations recorded. Major macro and industry news updates also showed no sudden events. During the Europe-US trading session
GateNews33m ago
BTC 15-minute surge of 0.84%: On-chain fund flow and technical breakout synergy drive volatility
March 13, 2026, 00:00 to 00:15 (UTC), BTC price fluctuated within the range of 70394.0 to 71116.3 USDT in just 15 minutes, with a return rate of +0.84% and volatility amplitude reaching 1.02%. During this period, mainstream market attention increased, driving active trading and notably elevated price volatility, reflecting a marked warming of market sentiment during this timeframe.
The primary driver of this price movement was large on-chain fund transfers and concentrated whale account buying activity. Historical on-chain data observations show that single transfers exceeding 1000 BTC have frequently served as catalysts for upward price movements.
GateNews33m ago
Oil prices soar past $100, U.S. stocks hit new lows for the year, Bitcoin holds steady at 70k
Due to the ongoing Iran conflict, oil prices have surged significantly, with Brent crude breaking $100 per barrel for the first time. U.S. stock indices' three major indexes hit new lows since 2026. The crypto market remained relatively stable, with Bitcoin holding around $70,000. Goldman Sachs warned that if oil supply remains weak, prices could spike to 2008 highs.
ChainNewsAbmedia1h ago
Chainlink (LINK) Price Prediction: What Comes Next After the Wave 5 Decline
Chainlink seems to have found a familiar groove. It has been moving sideways after the fall from the February highs of $12.50. Both bulls and bears are waiting for a clear trend in the cryptocurrency. The daily chop hides a more structured picture beneath the surface, one that technical
CaptainAltcoin1h ago