
Date: Mon, Dec 22, 2025 | 06:56 AM GMT
The broader altcoin market has experienced choppy and largely directionless price action over the past several weeks, a phase that began after the sharp sell-off on October 10. That correction dragged Ethereum (ETH) down from the sub-$4,700 region to the $3,000 area, leaving traders cautious and overall risk appetite muted. Over the last 60 days alone, ETH has declined by nearly 21%, reinforcing a short-term bearish narrative across the altcoin space.
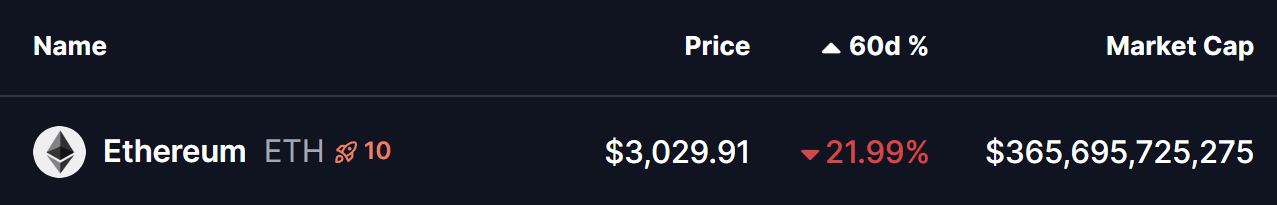
Source: Coinmarketcap
However, beneath the surface, the higher-timeframe technical structure is starting to hint at something far more constructive. Long-term signals on the ETH/BTC chart are now aligning in a way that has historically preceded major altcoin expansions, raising the possibility that the current weakness could be laying the groundwork for a bullish reversal into 2026.
ETH/BTC Chart Hints at a Bullish Altcoin Expansion
According to the latest analysis shared by @el_crypto_prof, the ETH/BTC weekly chart has once again recreated a structure that closely mirrors previous cycle transitions. This setup focuses on the interaction between the SMA100 and EMA100, two moving averages that have historically defined the beginning and end of major altcoin cycles.
In past market cycles, altcoin bull markets have tended to begin when the SMA100 crosses below the EMA100 — a bearish crossover that, counterintuitively, has marked long-term bottoms rather than tops. These moments often coincided with peak pessimism, underperformance of ETH versus BTC, and broad disinterest in altcoins.
Conversely, altcoin bull markets have historically ended when the SMA100 crosses back above the EMA100, signaling overheating conditions and the return of Bitcoin dominance.
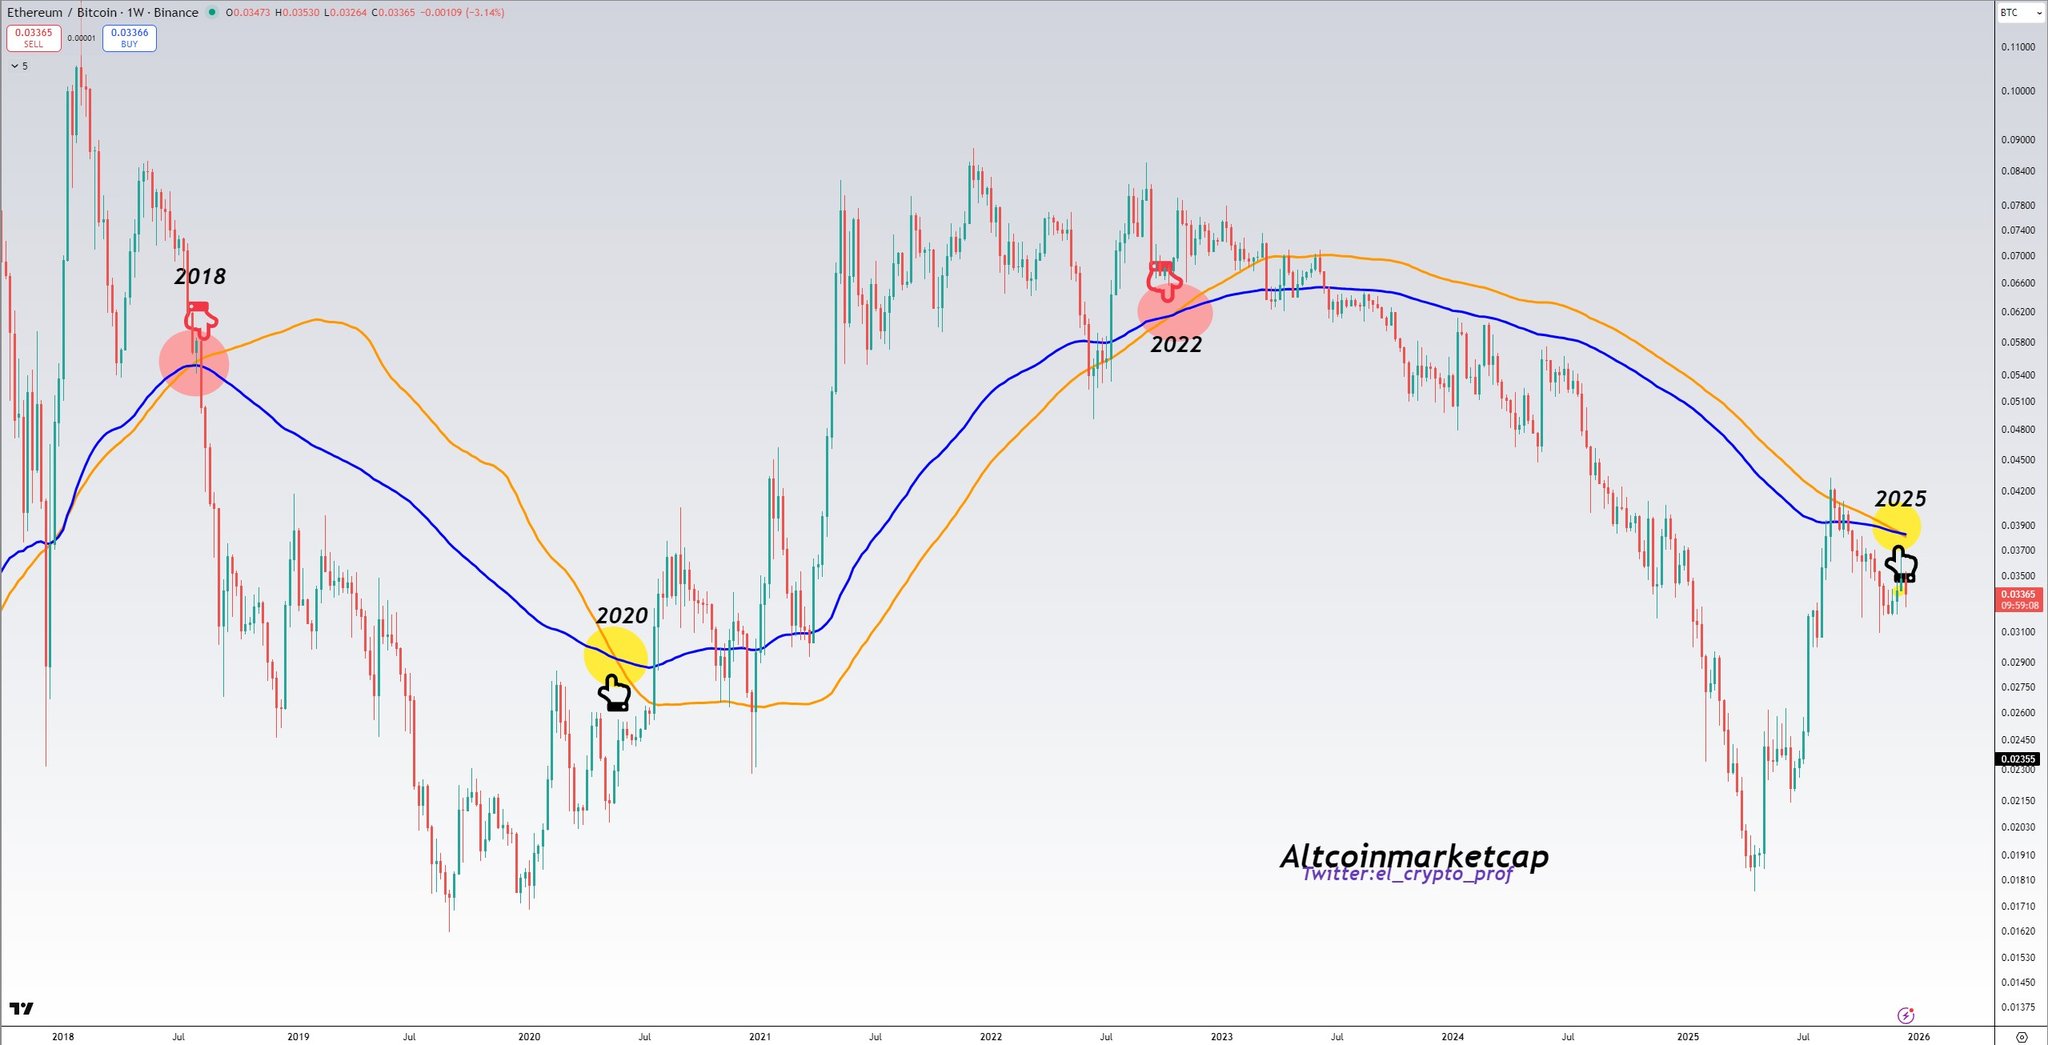
ETH-BTC Pair Chart/Credits: @el_crypto_prof (X)
The chart highlights three key moments:
In 2018, the bullish crossover marked the end of the altcoin cycle and preceded prolonged underperformance.
In 2020, the bearish crossover aligned closely with the start of a powerful altcoin expansion that carried into 2021.
In 2022, the bullish crossover once again signaled exhaustion and the onset of another prolonged correction.
Now, in 2025, the ETH/BTC pair has once again printed a bearish SMA100–EMA100 crossover, placing the market at a familiar inflection point. Historically, this has been the zone where altcoins quietly transition from distribution to accumulation.
What’s Next for Altcoins?
If this long-term setup continues to play out as it has in previous cycles, the coming months could mark the early stages of a broader altcoin recovery rather than the continuation of a downtrend. While short-term volatility and further downside cannot be ruled out, the structural signal suggests that downside risk may be gradually diminishing.
For altcoins, this phase has typically been characterized by range-bound price action, selective accumulation, and patience — followed by a sharp expansion once momentum returns and capital begins rotating out of Bitcoin.
Importantly, this is not a timing signal for immediate upside. Long-term moving average crossovers operate on a macro scale and often precede major rallies by months. But they do provide context: historically, these moments have offered some of the best risk-reward conditions for long-term altcoin exposure.
As 2026 approaches, the ETH/BTC chart suggests the altcoin market may be closer to a structural reset than many currently expect. If history repeats, today’s consolidation could ultimately be remembered as the calm before the next major altcoin cycle.
Disclaimer: The views and analysis presented in this article are for informational purposes only and reflect the author’s perspective, not financial advice. Technical patterns and indicators discussed are subject to market volatility and may or may not yield the anticipated results. Investors are advised to exercise caution, conduct independent research, and make decisions aligned with their individual risk tolerance.
Disclaimer: The information on this page may come from third parties and does not represent the views or opinions of Gate. The content displayed on this page is for reference only and does not constitute any financial, investment, or legal advice. Gate does not guarantee the accuracy or completeness of the information and shall not be liable for any losses arising from the use of this information. Virtual asset investments carry high risks and are subject to significant price volatility. You may lose all of your invested principal. Please fully understand the relevant risks and make prudent decisions based on your own financial situation and risk tolerance. For details, please refer to
Disclaimer.
Related Articles
XRP Supply Shift: Whales Add 200 Million Tokens as Price Eyes $1.50 - U.Today
XRP has seen a significant increase in whale activity, with 200 million XRP bought recently, while network activity and wallet numbers reach new highs. A "golden cross" signals potential price rises, as the SEC clarifies crypto asset regulations.
UToday1h ago
Bitcoin Breaks Below $71,000, Ethereum Falls Below $2,200! Nearly $300 Million in Liquidations Across the Network in 4 Hours, Inflation, Conflict, and Political Deadlock "Triple Kill" Crypto Market
The crypto market experienced a sharp decline on the evening of the 18th, with Bitcoin falling below $71,000 and Ethereum dropping to $2,200. The causes include U.S. PPI data exceeding expectations, which reduced the likelihood of Federal Reserve rate cuts; escalating Middle East conflicts increasing geopolitical risks; and gridlock in the U.S. Congress over crypto regulations. Market sentiment was severely damaged, with 110,000 people liquidated in just 4 hours, resulting in losses of $300 million.
動區BlockTempo3h ago
Here’s Where Gold Price Could Go After the FOMC Decision
Gold is in a bearish trend, forming a waterfall pattern with lower highs and lows. Watch the 4905 level; a break could lead to a drop toward 4841. Upcoming FOMC announcements may cause volatility, impacting price movements.
CaptainAltcoin3h ago
A Certain CEX Survey: 74% of Institutions Expect Cryptocurrency Market to Rebound in the Next 12 Months, Allocation Willingness Continues to Strengthen
Despite the crypto market's pullback since last year, the latest survey shows that institutional investor confidence remains solid, with 73% planning to increase digital asset allocation by 2026, and 74% expecting market recovery over the next 12 months. Most institutions prefer to invest through regulated instruments while focusing on regulatory clarity and risk management.
GateNews3h ago
Shiba Inu (SHIB) Shows Warning Signs as Price Hints at Another Dip
Shiba Inu price has returned to a delicate zone after several failed attempts to push higher. Recent price action shows SHIB struggling to break above a descending resistance line. That pattern has started raising concerns about another short-term decline.
Market observers began paying
CaptainAltcoin4h ago
