
Date: Tue, Dec 23, 2025 | 06:01 PM GMT
The broader cryptocurrency market has remained under pressure over the past several weeks, with the ongoing corrective phase weighing heavily on overall altcoin sentiment. Monad (MON) has also felt the impact of this weakness, as persistent selling pressure has kept price action subdued and volatile.
MON has declined by nearly 32% over the past 30 days, yet a closer look at the chart suggests that the current structure may be more constructive than it appears at first glance. Interestingly, Monad’s recent price behavior is beginning to resemble a bottoming pattern that previously played out on Hyperliquid (HYPE), a setup that eventually led to a powerful upside reversal earlier this year.
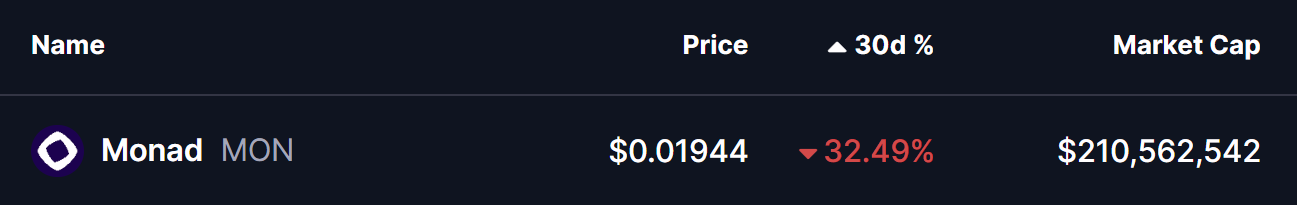
Source: Coinmarketcap
MON Mirrors HYPE’s Fractal Structure
On the comparative charts, MON appears to be tracing a structure strikingly similar to HYPE’s April 2025 fractal. In HYPE’s case, the token endured a deep 73% correction from its all-time high before forming a broadening wedge structure near the bottom. That consolidation phase ultimately resolved to the upside, with price reclaiming its key moving average and triggering a rally of more than 160% in the weeks that followed.
Monad’s decline from its own all-time high has reached roughly 65%, placing it well within the range of historical washout zones often associated with trend exhaustion. The current setup shows MON compressing within a symmetrical broadening wedge, a pattern that frequently precedes strong directional moves once price escapes the structure.
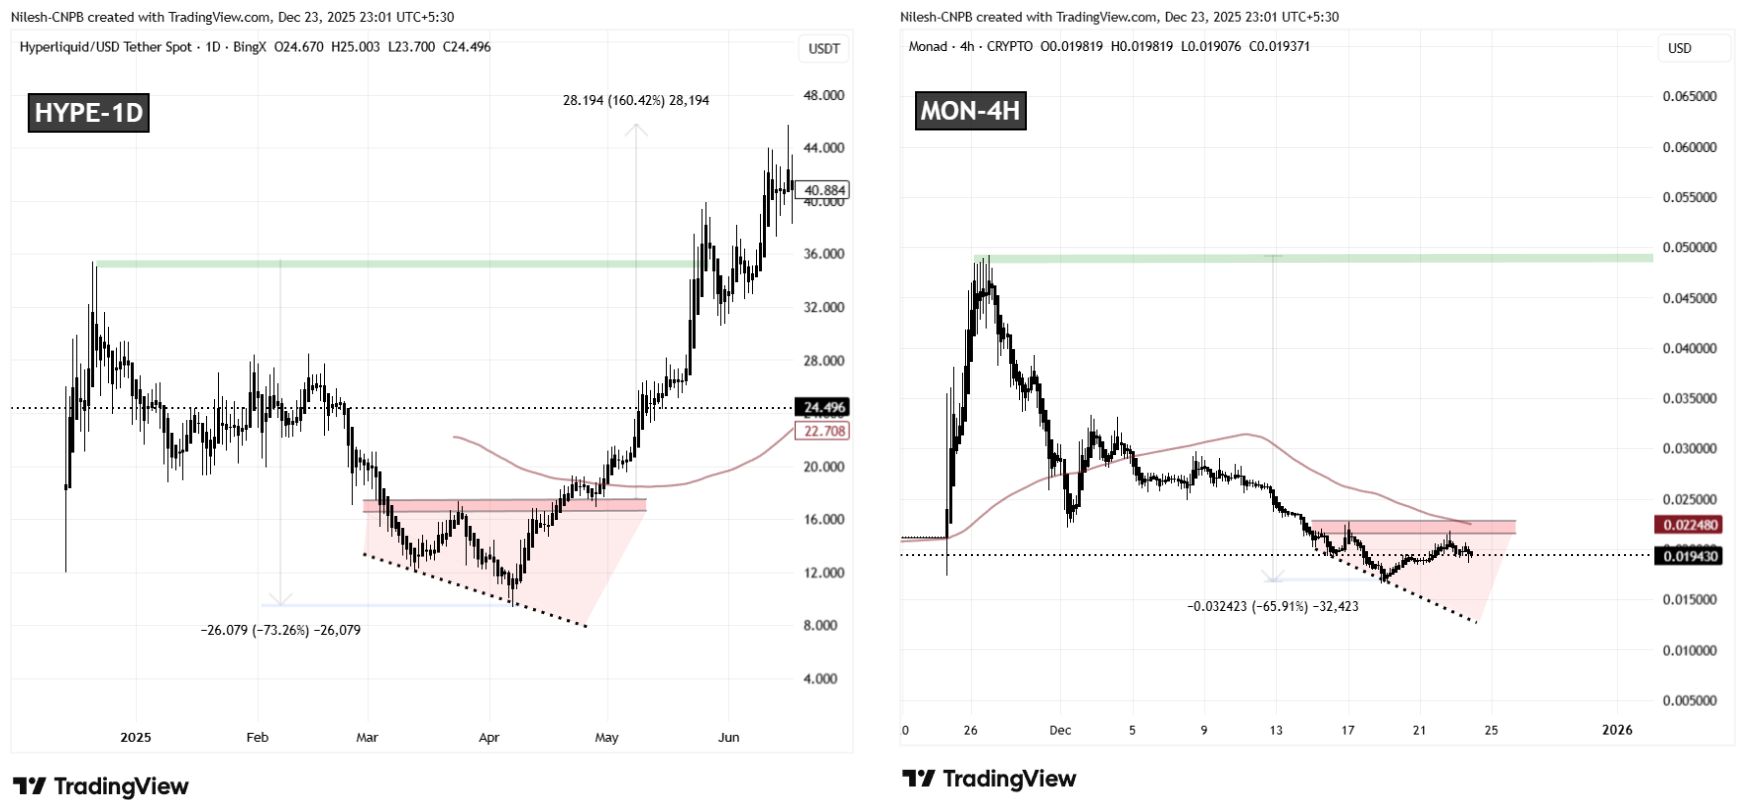
HYPE and MON Fractal Chart/Coinsprobe (Source: Tradingview)
This similarity becomes more compelling when viewed alongside the price behavior around resistance. MON is currently hovering just below a key neckline resistance band between $0.02170 and $0.02268, an area that closely mirrors the zone where HYPE consolidated before its breakout. The alignment between these two structures suggests that MON may be approaching a decision point.
What’s Next for MON?
Despite the growing resemblance to HYPE’s pre-breakout phase, the technical picture has not yet fully shifted in favor of the bulls. Sellers still retain short-term control, and confirmation is needed before a bullish reversal can be considered valid.
For momentum to flip decisively, MON would need to break above the upper boundary of the wedge and reclaim its 100 moving average, which sits near the $0.02248 level. A successful move above this region would signal improving trend strength and increase the probability that the fractal analogy continues to play out.
If such a breakout occurs, the upside potential becomes notable. A sustained bullish reversal could open the door for a broader recovery move toward the $0.049 area, which aligns with MON’s previous all-time high and represents roughly 155% upside from current levels. Until then, price action around resistance will remain critical in determining whether this fractal setup evolves into a full-fledged trend reversal or fails under continued market pressure.
**Disclaimer: **The views and analysis presented in this article are for informational purposes only and reflect the author’s perspective, not financial advice. Technical patterns and indicators discussed are subject to market volatility and may or may not yield the anticipated results. Investors are advised to exercise caution, conduct independent research, and make decisions aligned with their individual risk tolerance.
Disclaimer: The information on this page may come from third parties and does not represent the views or opinions of Gate. The content displayed on this page is for reference only and does not constitute any financial, investment, or legal advice. Gate does not guarantee the accuracy or completeness of the information and shall not be liable for any losses arising from the use of this information. Virtual asset investments carry high risks and are subject to significant price volatility. You may lose all of your invested principal. Please fully understand the relevant risks and make prudent decisions based on your own financial situation and risk tolerance. For details, please refer to
Disclaimer.
Related Articles
ETH rises 0.87% in 15 minutes: Large capital inflows and Layer2 ecosystem positive catalysts drive rally
Between 2026-03-16 03:15 and 03:30 (UTC), ETH spot price rose 0.87% within the range of 2180.04 to 2209.64 USDT, with a volatility amplitude of 1.36%. During this period, trading volume and on-chain transfer activity increased significantly, with elevated market attention and intensified short-term fluctuations. Long and short positions engaged in fierce competition, with net capital inflows notably favoring ETH, driving rapid price appreciation.
The primary driver of this price movement was multiple large-scale ETH transfers on-chain and a surge in stablecoin conversion volumes, with major capital inflows into leading exchanges, boosting both spot and derivatives trading activity.
GateNews4m ago
Santiment: Large Bitcoin Wallets Resume Accumulation, Fear and Greed Index May Diverge from ETF Inflows
According to data from on-chain analytics firm Santiment, as Bitcoin's price stabilizes near $71,000, large address holders now control approximately 68.17% of circulating supply, demonstrating an accumulation trend. Bitcoin reserves on exchanges have also fallen to eight-year lows, indicating that holders are more inclined toward long-term storage rather than selling. Despite the market's fear index remaining elevated, the renewed accumulation by large holders may signal a potential price rebound and provide structural support to the market.
MarketWhisper23m ago
Strait of Hormuz shipping crisis impacts industrial metals, BTC reclaims $71,300
Middle East tensions escalate as U.S. military takes action against Iranian energy facilities. Iran warns of retaliation, Strait of Hormuz transit volume declines, shipping risks rise, and aluminum supply chains tighten. U.S. 2022 GDP revised down to 0.7%, PCE remains at 3.1%, and the job market stays resilient. In the crypto market, BTC returns to the key level of 71,300 dollars.
GateNews42m ago
Spot/Futures Trading Volume Ratio of ETH on a Certain CEX Drops to Lowest Level Since 2023
According to analyst Darkfost's report, ETH open interest on a certain CEX platform has decreased significantly, with open positions declining by approximately 400,000 ETH since January. The spot-to-futures trading volume ratio has fallen to its lowest level since 2023, indicating weakness in the Ethereum spot market, with investor sentiment affected by selling activity.
GateNews46m ago
Bitcoin Approaching $73,000: Strong ETF Capital Inflows, BTC May Challenge $80,000 Level
Bitcoin's recent price rebound is approaching $73,000, driven by institutional capital inflows and geopolitical factors. Mainstream crypto assets such as Ethereum and XRP have also risen in sync. Research indicates that Bitcoin's gains are primarily sourced from ETF capital inflows and increased institutional holdings, with market sentiment recovering. Technical analysis shows $70,000 to $71,000 as support levels, with a breakthrough above $75,000 potentially triggering stronger gains.
GateNews51m ago
Dogecoin Futures Data Shows $0 Short Liquidations During Reset
Key Insights
Dogecoin futures recorded zero short liquidations within an hour, signaling a sharp drop in bearish bets as traders increasingly favored long positions.
DOGE gained over four percent during the past week, and that upward trend reduced aggressive short positions across
CryptoFrontNews55m ago