
Date: Wed, Dec 31, 2025 | 11:36 AM GMT
As the final day of 2025 arrives, the broader cryptocurrency market is showing modest strength. Both Bitcoin (BTC) and Ethereum (ETH) are trading slightly in the green, helping stabilize overall sentiment. This steady backdrop has created room for select altcoins — including Pump.fun (PUMP) — to begin forming constructive technical structures after prolonged downside pressure.
PUMP is starting to stand out, posting a nearly 5% daily gain and trimming its 60-day decline to around 57%. While the recovery is still early, the more important development is visible on the daily chart, where price action is beginning to hint at a meaningful structural shift. If confirmed, this setup could mark the early stages of a broader bullish continuation.
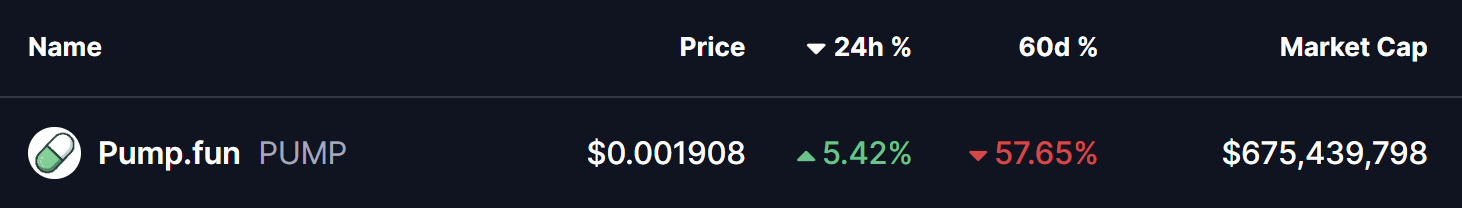
Source: Coinmarketcap
Rounding Bottom in Play
On the daily timeframe, PUMP appears to be carving out a classic rounding bottom formation — a well-known bullish reversal pattern that typically develops after an extended downtrend. This pattern reflects a slow but steady transition from aggressive selling to quiet accumulation, as sellers gradually lose control and buyers begin stepping in with more confidence.
Earlier in the trend, PUMP faced strong rejection near the $0.03396 neckline region, which triggered a sharp and extended decline. That sell-off eventually found a floor near the $0.0017 level, a zone that has since acted as a critical demand area. Multiple defenses of this region prevented further downside and laid the foundation for a potential trend reversal.
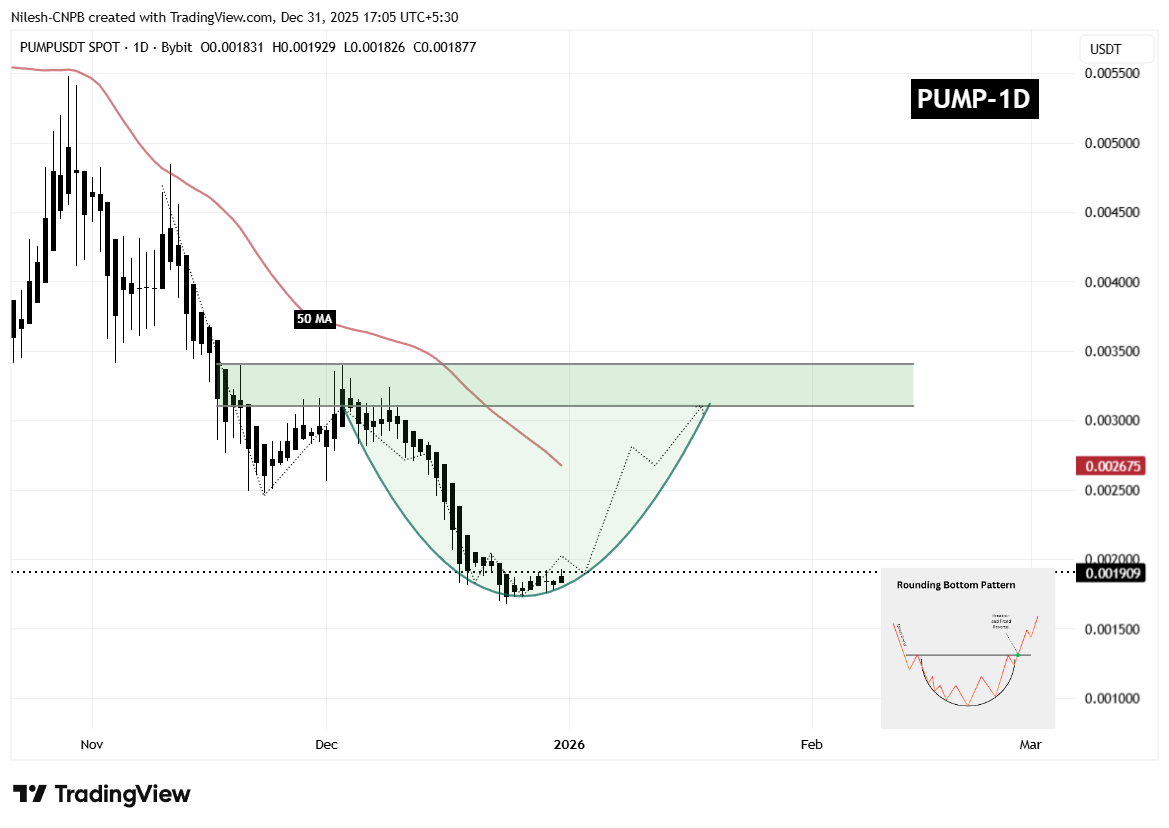
$PUMP Daily Chart/Coinsprobe (Source: Tradingview)
Since establishing this base, PUMP has started to curve higher in a rounded fashion on the chart. This gradual upward arc suggests that selling pressure is fading rather than ending abruptly — a key characteristic of healthier bottoming structures. The recent recovery above the $0.0019 region further supports the idea that accumulation is underway and that market participants are positioning ahead of a larger move.
What’s Next for PUMP?
For the rounding bottom structure to gain confirmation, PUMP needs to reclaim the 50-day moving average, currently hovering near the $0.002675 mark. A sustained move above this level would signal a shift in short-term momentum and reinforce the view that buyers are beginning to regain control after months of corrective price action.
Looking further ahead, the most significant technical barrier remains the neckline resistance around $0.03396. A clean and decisive breakout above this zone would validate the entire reversal pattern and could usher in a broader bullish expansion phase. Such a move would likely attract renewed interest from momentum traders who have remained sidelined during the prolonged downtrend.
Until those levels are reclaimed, the pattern remains in its development phase. Short-term consolidation or minor pullbacks cannot be ruled out, especially if price hesitates near the 50-day moving average. However, as long as PUMP continues to form higher lows and holds above the $0.0017 base, the broader rounding bottom structure remains intact.
Overall, PUMP is approaching a technically significant inflection point. The evolving rounding bottom pattern, improving price structure, and proximity to key resistance levels suggest that the coming sessions could be decisive in determining the token’s next major directional move as the market steps into 2026.
Disclaimer: The views and analysis presented in this article are for informational purposes only and reflect the author’s perspective, not financial advice. Technical patterns and indicators discussed are subject to market volatility and may or may not yield the anticipated results. Investors are advised to exercise caution, conduct independent research, and make decisions aligned with their individual risk tolerance.
About Author: Nilesh Hembade is the Founder and Lead Author of Coinsprobe, with over 5 years of experience in the cryptocurrency and blockchain industry. Since launching Coinsprobe in 2023, he has been providing daily, research-driven insights through in-depth market analysis, on-chain data, and technical research.

Disclaimer: The information on this page may come from third parties and does not represent the views or opinions of Gate. The content displayed on this page is for reference only and does not constitute any financial, investment, or legal advice. Gate does not guarantee the accuracy or completeness of the information and shall not be liable for any losses arising from the use of this information. Virtual asset investments carry high risks and are subject to significant price volatility. You may lose all of your invested principal. Please fully understand the relevant risks and make prudent decisions based on your own financial situation and risk tolerance. For details, please refer to
Disclaimer.
Related Articles
Cardano’s Chart Just Printed a “Black 9” – Here’s Where ADA Price Could Go Next
Ali Martinez highlights a significant technical signal for Cardano, specifically the TD Sequential indicator showing a "black 9," suggesting a potential price reversal after a prolonged downtrend. If ADA maintains support at $0.23, it could rise to $0.32 and $0.37. However, failure to hold this level might invalidate the bullish setup.
CaptainAltcoin12m ago
Market Experts Insist Funds Won't Flow from Gold to Bitcoin, BTC Pullback Synchronizes with XAU
Market expert Benjamin Cowen stated that Bitcoin is unlikely to attract capital inflows due to a gold price pullback. Bitcoin and gold prices show high correlation in volatility, with Bitcoin recently declining from $76,000 to $70,000, while gold plummeted 8.54%. Although Bitcoin's price performance against gold demonstrates resilience, Cowen pointed out that market rotation has not yet occurred, and investors need to monitor Bitcoin's support levels to assess risks.
GateNews15m ago
Six Countries Unite to Stabilize Energy Market, Oil Prices Fall Nearly 2%, Bitcoin Rebounds to $70,800
On March 20, a multi-country coordinated action stabilized the energy market, oil prices fell, and Bitcoin rebounded to $70,800 at one point, gaining over 1% for the day. Mainstream coins such as Ethereum and XRP rose less than 1%. Market uncertainty remains, stock market momentum has shifted to bearish, which could impact financial markets.
GateNews24m ago
Bitcoin Shows Resilience Amid Oil Boom Impact, $70,000 Key Support Level Becomes Rebound Focus
Bitcoin demonstrates resilience amid global market volatility, outperforming most assets despite recent declines exceeding 3%. Analysts point out that the support zone of 69,000 to 70,000 USD is crucial for future price movements, and holding this level could trigger a rebound. Overall, Bitcoin exhibits clear safe-haven characteristics against the backdrop of geopolitical tensions and soaring oil prices.
GateNews27m ago
STRC Current Value Reveals MSTR Risk: Bitcoin Accumulation Commitment May Fall Short
Strategy's dividend preferred stock Stretch (STRC) may be overvalued due to its high annualized dividend yield of 11.5% and significantly increased future payment obligations. While it may improve the balance sheet in the short term, if Bitcoin's appreciation fails to exceed the high dividend yield, common shareholders' returns will be limited, and the market remains cautious about STRC's long-term sustainability.
GateNews29m ago
