
**Date: **Tue, Jan 06, 2026 | 06:20 AM GMT
The broader cryptocurrency market continues to show fresh strength as 2026 unfolds. Bitcoin (BTC) and Ethereum (ETH) are both up more than 7% on the week, helping improve overall market sentiment. This renewed momentum is gradually spreading across major altcoins — including Pi Network (PI).
While PI has recorded a modest 5% gain over the past week, the more important development is taking shape on the chart. On lower timeframes, price action is compressing into a well-defined bullish structure, suggesting the token may be preparing for a meaningful breakout if resistance is reclaimed.
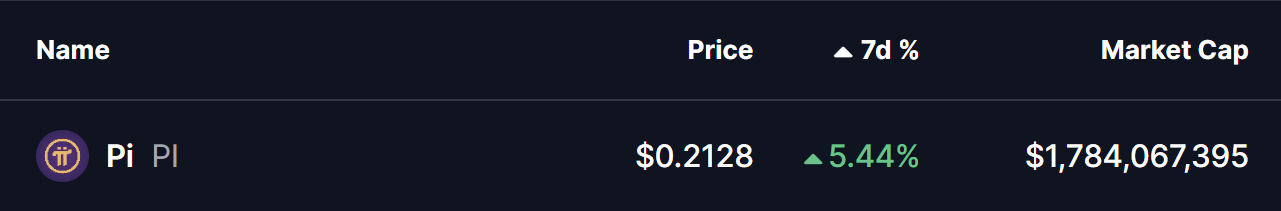
Source: Coinmarketcap
Ascending Triangle Taking Shape
On the 4-hour chart, Pi Network is forming a clear ascending triangle pattern. This structure is defined by a series of higher lows pressing steadily into a flat resistance zone, signaling persistent buying interest despite repeated rejections at the same level. Ascending triangles are widely considered bullish continuation patterns, particularly when they develop after an extended consolidation phase.
PI recently bounced cleanly from its rising support trendline, once again pushing price toward the upper boundary of the triangle around the $0.2129–$0.2160 region. The ability to repeatedly defend higher lows suggests that buyers remain in control and are willing to accumulate on dips rather than exit positions.
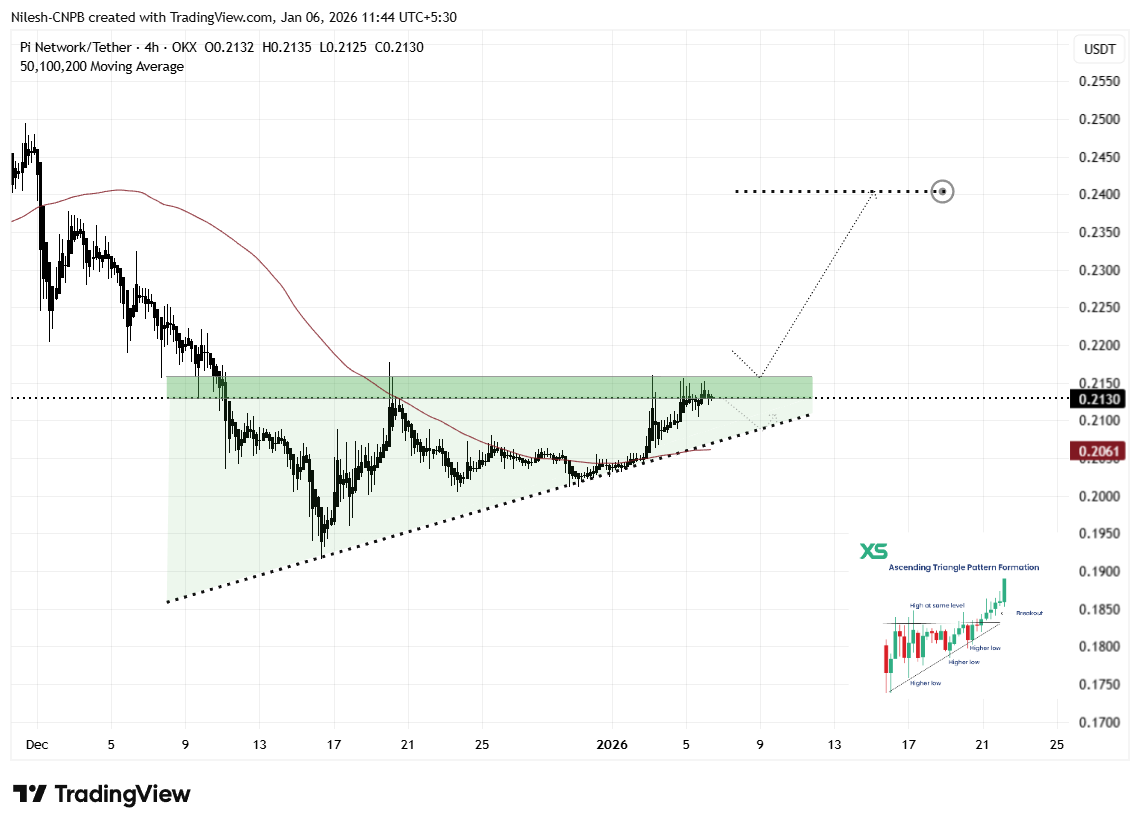
_ Pi Network (PI) 4H Chart/Coinsprobe (Source: Tradingview)_
Rather than signaling weakness, this sideways-to-higher price action reflects healthy consolidation. Volatility continues to compress, which often precedes a larger directional move as the market approaches a decision point.
What’s Next for PI?
From here, PI appears set for another test of the $0.2160 resistance zone. A decisive breakout above this level, followed by sustained acceptance and a successful retest as support, would confirm the ascending triangle structure and likely trigger a stronger bullish expansion.
Based on the measured move of the pattern, the technical upside projection points toward the $0.2404 area. This represents a potential upside of roughly 13% from current levels and also aligns with previous price structure, reinforcing the bullish case.
That said, caution remains important. If PI fails to break above resistance, price could rotate back toward the rising support trendline once again. As long as this ascending support holds, the broader bullish structure remains intact. A clear breakdown below the trendline, however, would invalidate the pattern and delay any breakout scenario.
For now, the combination of improving market sentiment and a tightening ascending triangle suggests Pi Network is approaching a critical inflection point — one that could define its next major move as the new year progresses.
Disclaimer: The views and analysis presented in this article are for informational purposes only and reflect the author’s perspective, not financial advice. Technical patterns and indicators discussed are subject to market volatility and may or may not yield the anticipated results. Investors are advised to exercise caution, conduct independent research, and make decisions aligned with their individual risk tolerance.
About Author: Nilesh Hembade is the Founder and Lead Author of Coinsprobe, with over 5 years of experience in the cryptocurrency and blockchain industry. Since launching Coinsprobe in 2023, he has been providing daily, research-driven insights through in-depth market analysis, on-chain data, and technical research.
Disclaimer: The information on this page may come from third parties and does not represent the views or opinions of Gate. The content displayed on this page is for reference only and does not constitute any financial, investment, or legal advice. Gate does not guarantee the accuracy or completeness of the information and shall not be liable for any losses arising from the use of this information. Virtual asset investments carry high risks and are subject to significant price volatility. You may lose all of your invested principal. Please fully understand the relevant risks and make prudent decisions based on your own financial situation and risk tolerance. For details, please refer to
Disclaimer.
Related Articles
Japan XRP Payment Rumors Ignite Massive Market Speculation
Japan's crypto landscape is buzzing with potential XRP adoption for payments, fueled by partnerships and regulatory developments, though no official mandate is in place yet. Speculative claims highlight a promising future for XRP amid ongoing fintech experiments.
Coinfomania18m ago
XRP Network is On Fire: Why Daily Transactions Just Tripled to a Massive 3 Million
If you’ve been waiting for "utility" to finally show up in the crypto charts, March 2026 just delivered. The XRP Ledger (XRPL) has officially hit a massive milestone, with daily transactions tripling to reach 3 million.
This isn't just a small bump; it’s a full-blown explosion in network usage.
Cryptoknowmics49m ago
Hyperliquid HYPE Price Climbs Toward $38 as Market Activity Rebounds
Key Insights
Hyperliquid HYPE rebounded from the $20 support zone and now trades near $37 as improving market activity strengthens the developing recovery trend.
Technical structure shows higher lows since January while resistance near $38 and $40 now determines whether bullish momentum
CryptoFrontNews1h ago
美國後悔打伊朗了?加密沙皇David Sacks建議川普「趕快宣布勝利後撤軍」
川普欽點的「AI 與加密貨幣沙皇」David Sacks 公開喊話美國應該「宣告勝利然後撤出」伊朗戰場,並警告繼續升級將是災難性的。
(前情提要:戰爭陰影下,加密市場再度淪為驚弓之鳥?)
(背景補充:讀懂川普的「戰爭劇本」,投資者必須知道的十個訊號)
美國打完了嗎?還是打得有點後悔?
3 月 13 日,川普的核心圈子裡傳出了一個耐人尋味的聲音。David Sacks,就是被川普親自欽點、掌管 AI 與加密政策的「加密沙皇」,在 All-In Podcast 上表示美國應該「宣告勝利,然後撤出」。
他警告,如果繼續打下去,結果會是「catastrophic」災難性的。
他在怕什
動區BlockTempo1h ago
比特幣絕佳買點到?PlanB 更新 S2F 模型 :本輪週期均價上看 50 萬美元
量化分析師PlanB提出比特幣預測模型S2F,預計2024至2028年間比特幣將平均達50萬美元。雖近期價格約67,000美元,但PlanB認為當前是最佳買入時機。S2F模型基於資產稀缺性,歷史預測多次命中,顯示市場尚未過熱。然而,他也承認模型有盲點,需關注需求面動態。
区块客1h ago
USDC實質交易量超越USDT,為成熟市場支付的好選擇
瑞穗證券報告顯示,穩定幣USDC今年的「經調整後交易量」已超越USDT,達到64%。USDC憑藉合規性在成熟市場中受青睞,特別在北美流通量遠高於USDT。USDC一年成長26%,而USDT略有下滑,顯示出市場對兩者使用的不同邏輯。隨著數位支付需求增長,USDC的實體支付功能可能進一步深化。
ChainNewsAbmedia1h ago