
Date: Fri, Jan 02, 2026 | 09:15 AM GMT
The broader cryptocurrency market has started the new year on a stable footing, with both Bitcoin (BTC) and Ethereum (ETH) trading slightly higher and posting gains of over 1.5%. This modest strength across major assets has provided breathing room for risk-on sentiment, allowing several memecoins to show early signs of recovery — including Popcat (SOL) (POPCAT).
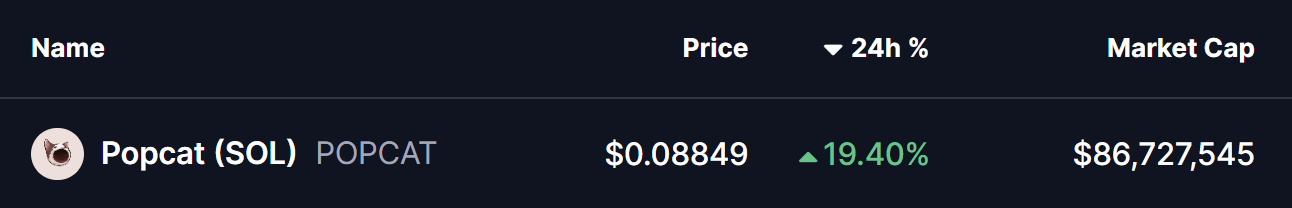
POPCAT is currently trading by solid 19% higher on the day, but the more important development lies in its broader technical structure. After months of consistent downside pressure, the price action is now beginning to hint at a potential trend reversal, supported by a well-defined bullish pattern forming on the daily chart.
Source: Coinmarketcap
Falling Wedge Pattern in Play
On the daily timeframe, POPCAT appears to be carving out a falling wedge formation — a classic bullish reversal pattern that often develops after extended downtrends. This structure is characterized by lower highs and lower lows that gradually converge, reflecting weakening selling pressure and growing buyer interest near the lows.
Following weeks of steady decline, POPCAT recently established a local bottom near the $0.0725 region. This area acted as a strong demand zone, where buyers stepped in aggressively and prevented further downside. The resulting rebound pushed price back toward the $0.088 level, placing POPCAT just beneath the wedge’s upper resistance trendline.
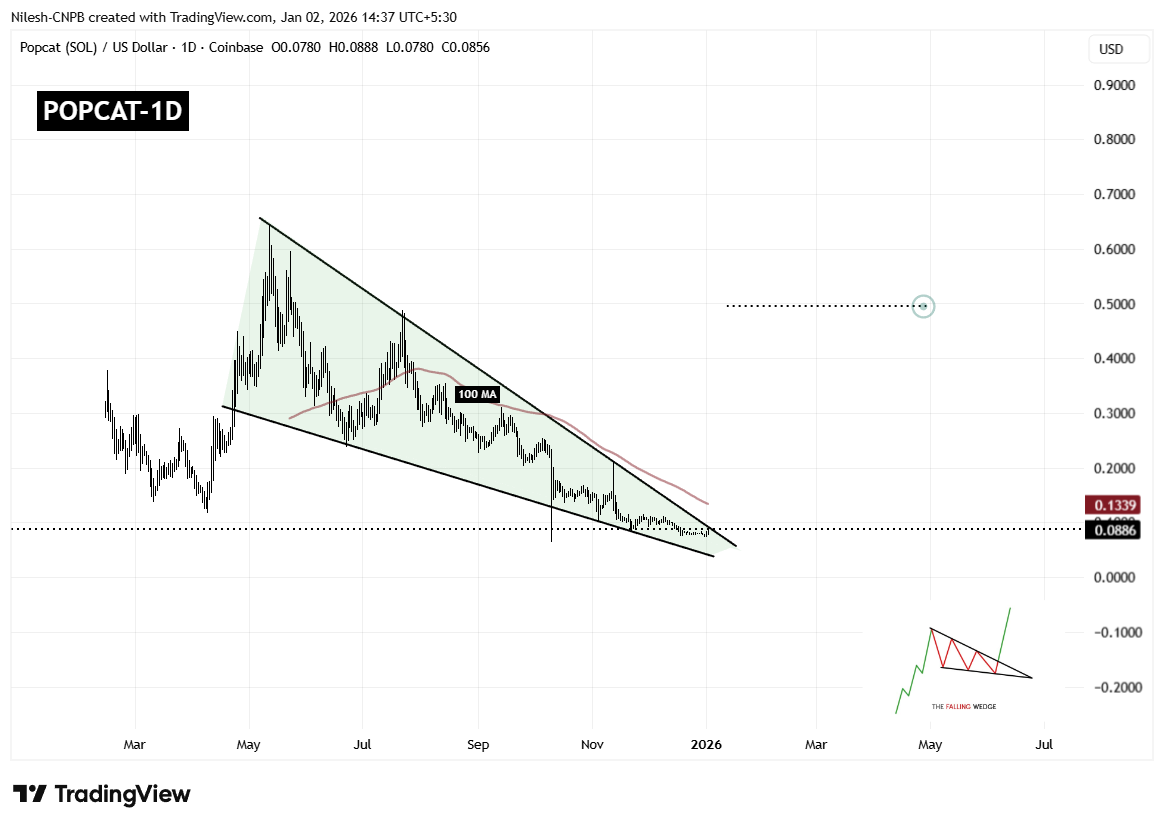
Popcat (POPCAT) Daily Chart/Coinsprobe (Source: Tradingview)
This compression near resistance is technically significant, as falling wedges tend to resolve with a sharp upside move once price breaks out of the structure. The longer price coils within the wedge, the stronger the eventual breakout tends to be.
However, overhead resistance remains notable. The 100-day moving average, currently hovering around $0.1339, represents a major technical barrier. This level has previously acted as dynamic resistance and will likely be a key area to watch if a breakout occurs.
What’s Next for POPCAT?
If buyers manage to push price decisively above the wedge resistance and reclaim the 100-day moving average with a strong daily close, POPCAT could confirm a bullish breakout. Such a move would mark a clear shift in trend structure and could open the door for a larger recovery rally.
Based on the measured move of the falling wedge pattern, the upside projection points toward the $0.49 region. Reaching this level would represent a substantial recovery from current prices and could attract renewed interest from momentum traders and sidelined participants.
That said, failure to break above resistance could result in continued consolidation. In a bearish scenario, POPCAT may revisit the $0.072 support zone once again. As long as this level continues to hold, the broader falling wedge structure would remain intact, keeping the bullish reversal thesis alive.
Overall, POPCAT is approaching a technically critical juncture. With price tightly compressed, selling pressure fading, and buyers defending key support levels, the coming sessions could prove decisive in determining whether this memecoin is ready to stage its next meaningful move higher.
Disclaimer: The views and analysis presented in this article are for informational purposes only and reflect the author’s perspective, not financial advice. Technical patterns and indicators discussed are subject to market volatility and may or may not yield the anticipated results. Investors are advised to exercise caution, conduct independent research, and make decisions aligned with their individual risk tolerance.
About Author: Nilesh Hembade is the Founder and Lead Author of Coinsprobe, with over 5 years of experience in the cryptocurrency and blockchain industry. Since launching Coinsprobe in 2023, he has been providing daily, research-driven insights through in-depth market analysis, on-chain data, and technical research.
Disclaimer: The information on this page may come from third parties and does not represent the views or opinions of Gate. The content displayed on this page is for reference only and does not constitute any financial, investment, or legal advice. Gate does not guarantee the accuracy or completeness of the information and shall not be liable for any losses arising from the use of this information. Virtual asset investments carry high risks and are subject to significant price volatility. You may lose all of your invested principal. Please fully understand the relevant risks and make prudent decisions based on your own financial situation and risk tolerance. For details, please refer to
Disclaimer.
Related Articles
Aptos Shows Momentum: Could APT Break Resistance Soon?
APT tests $1 resistance, forming higher lows and showing steady buyer conviction.
Rising triangle, A/D, and MFI indicators suggest building bullish momentum.
Confirmation above $1 could trigger breakout, but BTC stability and caution remain important.
Aptos — APT, has been gaining
CryptoNewsLand6m ago
Bitcoin Gold Price Soars 12.83%: Institutional Interest Grows
Bitcoin Gold's price surged by 12.83% to $0.554349, reflecting increased market interest, particularly from institutional investors. Active trading indicates growing retail participation. Traders are monitoring key price levels for potential future trends.
Coinfomania9m ago
Bitcoin shows resilience, options market indicates easing of downside concerns
Despite international oil prices rising to $115 and the market shifting to a defensive stance, Bitcoin has shown resilience, with options flow indicating reduced downside concerns. Market optimism towards Bitcoin is returning, with focus on this week's economic data.
GateNews24m ago
'Bull Trap Forming' – Willy Woo Says Bottom Not In for Bitcoin
Willy Woo, an on-chain analyst, warns that Bitcoin's recent rally may be a "bull trap," suggesting the market remains in a downward trend and that the true bottom has not yet been reached. Traders should remain cautious and watch for potential lower prices.
Coinpedia1h ago
Trump says oil prices will quickly fall back, but Bitcoin and the stock market have already been hit
On March 9th, as the "Epic Rage Action" escalated, the global energy markets experienced intense volatility, with oil prices soaring to $116 at one point, raising concerns about supply disruptions through the Strait of Hormuz. Trump predicted that oil prices would fall back, but gasoline prices have already risen to $3.45. The stock and cryptocurrency markets declined sharply, and investors should pay attention to the impact of geopolitical events on the markets and future monetary policies.
GateNews1h ago
Ethereum Price News: Co-founder Jeffrey Wilcke transfers $157 million worth of ETH to CEX, can the key support level of $1920 hold?
Ethereum (ETH) recently dropped nearly 8%, hitting a low of $1912, mainly due to market concerns over the founder transferring a large amount of ETH. However, institutional investors remain actively involved, with a short-term support level at $1920. If maintained, a rebound to $2000 is possible. Technical analysis shows bearish signals, and future trends will depend on the performance of large holders and support levels.
GateNews1h ago