Top 3 cryptocurrency price predictions: BTC, ETH, and XRP pause before a key resistance zone
Bitcoin (BTC), Ethereum (ETH), and Ripple (XRP) are showing signs of stabilization during Wednesday’s trading session, as they fluctuate near key resistance levels after a strong upward rally. Bitcoin faced selling pressure at the $94,253 level, while Ethereum and Ripple weakened simultaneously, encountering obstacles around $3,308 and $2.35 respectively. The movements of these three largest market cap cryptocurrencies indicate a cautious sentiment returning, signaling a short-term “cooling-off” phase before the upward trend may continue.
Bitcoin Rejected Near the Resistance Zone of $94,253
Bitcoin’s price showed positive signals by closing above the $90,000 accumulation zone on Saturday. The bullish momentum pushed BTC up nearly 4%, approaching and testing the 61.8% Fibonacci retracement level—measured from the April low of $74,508 to the October all-time high of $126,199—around $94,253 on Monday. However, the rally quickly weakened as BTC failed to sustain a close above this critical resistance on Tuesday. Moving into Wednesday, the leading cryptocurrency traded slightly lower, around $92,700.
In an optimistic scenario, if BTC closes decisively above $94,253, the bullish trend could be extended, opening room to reach the key psychological level of $100,000.
 Daily BTC/USDT Chart | Source: TradingView
From a technical perspective, the RSI remains around 59, above the neutral threshold of 50, indicating that bullish momentum still dominates. Meanwhile, the MACD indicator has formed a bullish crossover, with expanding green histogram bars above the neutral line, further supporting a short-term positive outlook.
Conversely, if selling pressure increases and BTC closes below the 50-day EMA at $91,774, the price risks falling further, testing the important support zone around $90,000.
Ethereum May Extend Gains if Closing Above the 100-Day EMA
Ethereum’s price broke out and closed above a key daily resistance zone at $3,017 on Friday, then maintained an upward momentum of nearly 6% through Tuesday, approaching and testing the 100-day EMA around $3,308. On Wednesday, ETH showed signs of slight consolidation, trading near $3,272.
In an optimistic scenario, if Ethereum can close firmly above the 100-day EMA at $3,308 on the daily timeframe, the rally is likely to continue, targeting the recent high set on 12/10 at $3,447.
 Daily ETH/USDT Chart | Source: TradingView Similar to Bitcoin, Ethereum’s key technical indicators such as RSI and MACD are also signaling positive momentum, reinforcing the short-term bullish outlook.
On the other hand, in case of a correction, ETH could retreat to test the support zone at the 50-day EMA, around $3,134.
Ripple’s Uptrend Pauses After Testing Important Resistance Zone
Ripple’s price successfully broke above the $1.96 resistance level on Friday, then gained over 16% through Monday, approaching the critical resistance at $2.35. However, failing to break through this barrier triggered profit-taking pressure, leading XRP into a correction the following day. As of Wednesday, the coin is trading around $2.27, below its recent short-term high.
In an optimistic scenario, if XRP can close firmly above $2.35 on the daily timeframe, the upward momentum could be extended, targeting the next resistance zone at $2.72.
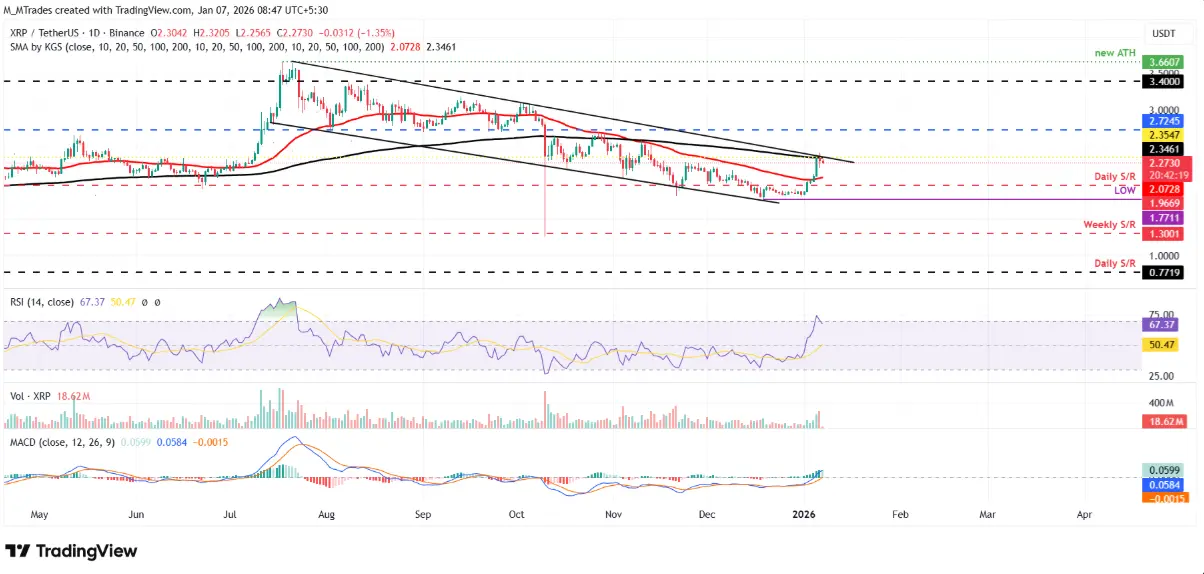 Daily XRP/USDT Chart | Source: TradingView Similar to Bitcoin and Ethereum, XRP’s key momentum indicators such as RSI and MACD continue to signal bullishness, supporting a positive price trend.
Conversely, if selling pressure increases, XRP risks retreating to test the 50-day EMA, currently around $2.07.
Related Articles
Bitcoin OG Withdraws $77.47M USDT from CEX for Loan Repayment
Bitcoin faces liquidity trap as China may sell $298 billion in US bonds
Strategy Accelerates Bitcoin Buyouts As Market Downtrend Leads to Aggressive Accumulation
Bitcoin Downturn Is a ‘Crisis of Confidence,’ Not a Broken Market: Bernstein
US Spot Bitcoin ETFs See Renewed Inflows as Selling Pressure Eases
Data: If BTC drops below $65,731, the total long liquidation strength on mainstream CEXs will reach $1.21 billion.