
Date: Thu, Jan 01, 2026 | 10:30 AM GMT
As the new year 2026 begins, the broader cryptocurrency market is showing modest weakness, with both Bitcoin (BTC) and Ethereum (ETH) trading slightly in the red. This soft start has weighed on sentiment across the altcoin space as well, including Monad (MON). However, beneath the surface, MON’s chart structure is beginning to tell a more constructive story.
MON is currently down around 4% on the day, extending its 60-day decline to roughly 21%. While short-term price action remains subdued, the more important signal is emerging on the daily chart, where price structure is beginning to hint at a meaningful shift. If confirmed, this setup could mark the early stages of a bullish continuation following a prolonged corrective phase.
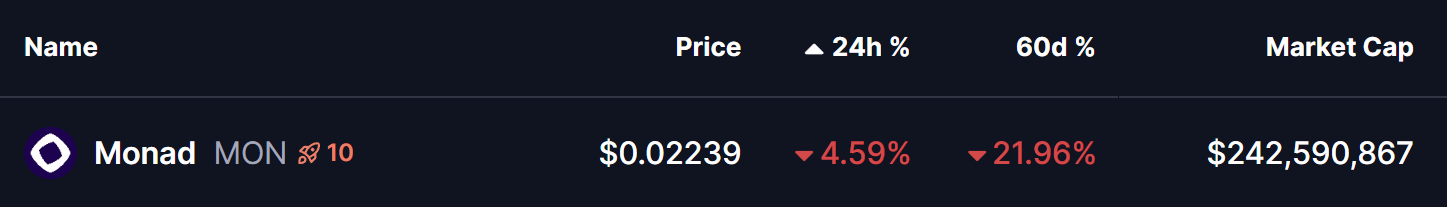
Source: Coinmarketcap
Rounding Bottom in Play
On the daily timeframe, MON appears to be forming a textbook rounding bottom pattern — a classic bullish reversal structure that typically develops after extended downside pressure. This pattern reflects a gradual transition from distribution to accumulation, where selling momentum weakens and buyers begin to step in more consistently.
Previously, MON faced strong rejection near the $0.04923 neckline zone, triggering a sharp decline that unfolded through late November and December. That move eventually found a floor near the $0.017 level, which has since acted as a key demand zone. Repeated defenses of this area prevented any deeper breakdown and helped establish a stable base for a potential trend reversal.
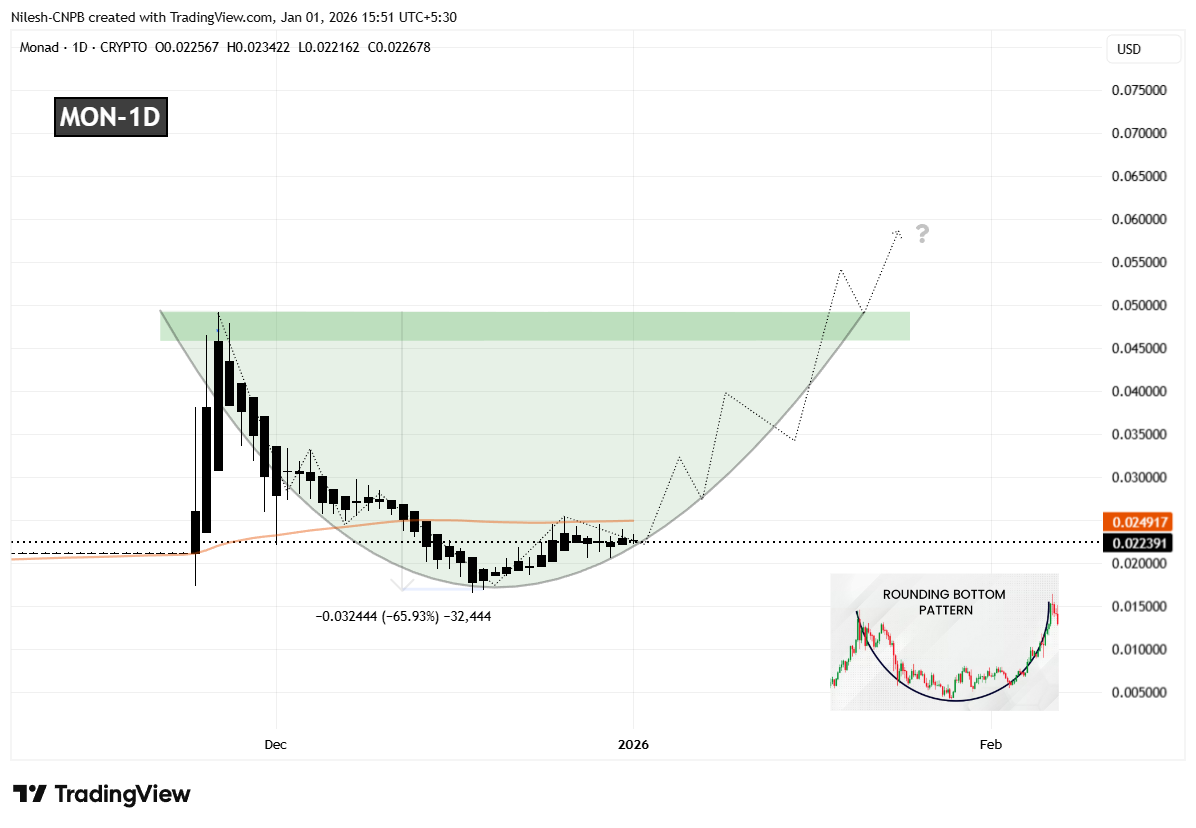
Monad (MON) Daily Chart/Coinsprobe (Source: Tradingview)
Since forming that bottom, MON has started to curve higher in a rounded fashion, closely matching the classic structure of a developing bottoming pattern. This gradual recovery suggests that selling pressure is fading rather than accelerating. The recent stabilization and recovery back above the $0.022 region further indicate that accumulation may be taking place as the market quietly prepares for a larger move.
What’s Next for MON?
For the rounding bottom pattern to move into confirmation, MON needs to reclaim the 50-day moving average, currently positioned near the $0.02491 level. A sustained move above this area would signal a shift in short-term momentum and confirm that buyers are beginning to regain control after months of corrective price action.
Looking ahead, the most significant technical hurdle remains the neckline resistance around $0.04923. A clean and decisive breakout above this zone would validate the entire reversal structure and could open the door for a broader bullish expansion phase, with momentum traders likely returning to the market.
Until those levels are reclaimed, the pattern remains in its early development stage. Short-term pullbacks or consolidation remain possible if MON struggles near the 50-day moving average. However, as long as price continues to hold higher lows above the $0.017 base, the broader bottoming structure remains intact.
Overall, MON’s emerging rounding bottom formation suggests the token may be approaching an important inflection point. While confirmation is still pending, the improving structure and alignment with a classic bullish pattern indicate that the coming sessions could be decisive for Monad’s next directional move.
Disclaimer: The views and analysis presented in this article are for informational purposes only and reflect the author’s perspective, not financial advice. Technical patterns and indicators discussed are subject to market volatility and may or may not yield the anticipated results. Investors are advised to exercise caution, conduct independent research, and make decisions aligned with their individual risk tolerance.
About Author: Nilesh Hembade is the Founder and Lead Author of Coinsprobe, with over 5 years of experience in the cryptocurrency and blockchain industry. Since launching Coinsprobe in 2023, he has been providing daily, research-driven insights through in-depth market analysis, on-chain data, and technical research.
Disclaimer: The information on this page may come from third parties and does not represent the views or opinions of Gate. The content displayed on this page is for reference only and does not constitute any financial, investment, or legal advice. Gate does not guarantee the accuracy or completeness of the information and shall not be liable for any losses arising from the use of this information. Virtual asset investments carry high risks and are subject to significant price volatility. You may lose all of your invested principal. Please fully understand the relevant risks and make prudent decisions based on your own financial situation and risk tolerance. For details, please refer to
Disclaimer.
Related Articles
Cryptocurrency Fear and Greed Index Falls to 8 Today, Market Extreme Panic Sentiment Deepens
Gate News reported that on March 23rd, according to Alternative.me data, today's cryptocurrency fear and greed index fell to 8, declining further from yesterday's 10. The index indicates the market is currently in a state of extreme panic, with panic sentiment continuing to deepen.
GateNews43m ago
The Hormuz Strait crisis remains unresolved, and Bitcoin has fallen below 68K.
Affected by the US-Iran conflict, global markets have been severely impacted, with the S&P 500 Index declining for four consecutive weeks. Gold has experienced a modest rebound around $4,500, while oil prices remain stable at elevated levels. Trump has issued an ultimatum to Iran, with potential escalation of conflict between the two sides. Bitcoin and Ethereum have also declined in tandem, and market sentiment has turned conservative.
ChainNewsAbmedia55m ago
River (RIVER) Price Keeps Pumping as TD Indicator Signals Another Rally
Analyst Ali Martinez highlights the accuracy of the TD Sequential indicator in predicting River (RIVER) price movements. The indicator has consistently identified significant buy and sell signals throughout RIVER's volatility, suggesting potential future trends based on current signals.
CaptainAltcoin2h ago
ETH 15-minute decline of 0.88%: Capital outflow dominates market, intensifying short-term selling pressure
On March 22, 2026, from 21:00 to 21:15 (UTC), Ethereum (ETH) recorded a -0.88% return rate within 15 minutes, with the price fluctuating in the range of 2029.54 to 2060.75 USDT, reaching an amplitude of 1.52%. Market attention has increased, short-term volatility has significantly intensified, reflecting rapid conversion of funding pressure into price pressure.
The main driver of this anomaly is accelerated capital outflows from trading platforms: approximately 420,690 USD equivalent of ETH flowed in within 10 minutes, but the number of withdrawals reached 2,319 transactions in the past 1 hour, far exceeding deposits during the same period by 5
GateNews3h ago
BTC Drops 0.58% in 15 Minutes: Tight Liquidity and Institutional Hedging Create Downward Pressure
2026-03-22 21:00 to 21:15 (UTC), BTC recorded a -0.58% return within just 15 minutes, with prices fluctuating in the range of 67562.1 to 68223.5 USDT, with an amplitude of 0.97%. During this period, market sentiment was highly tense, overall attention increased, and short-term volatility accelerated noticeably.
The main driving force behind this anomaly was the resonance formed by spot market liquidity shortage and medium-sized funds accelerating their exit. On-chain data shows a significant net outflow of -371.99 BTC in the $100k-$1M transaction range, driving selling
GateNews3h ago
