Pump.fun (PUMP), Story (IP), and Pudgy Penguins (PENGU) are experiencing a strong sell-off wave over the past 24 hours, indicating that market sentiment remains cautious. Both PUMP and IP are powerless against the important resistance level of the 50-day exponential moving average (EMA), triggering a correction phase on Wednesday’s trading session. Meanwhile, PENGU is retreating to test the 50-day EMA, reflecting ongoing profit-taking pressure. Overall, the technical outlook for these three cryptocurrencies remains negative, as the downward trend continues to dominate amid existing weakness.
Pump.fun faces the risk of sharp decline as bullish momentum wanes
As of Thursday when this article was written, Pump.fun is fluctuating around the 20-day EMA at $0.002248, after plunging 11% from the 50-day EMA at $0.002624 in the previous session. This move officially ends the eight consecutive bullish sessions for the token.
If PUMP loses the support zone at $0.002248, selling pressure could increase, pushing the price down to the psychological level of $0.002000. Further, the correction risk may extend to the S1 Pivot point at $0.001262.
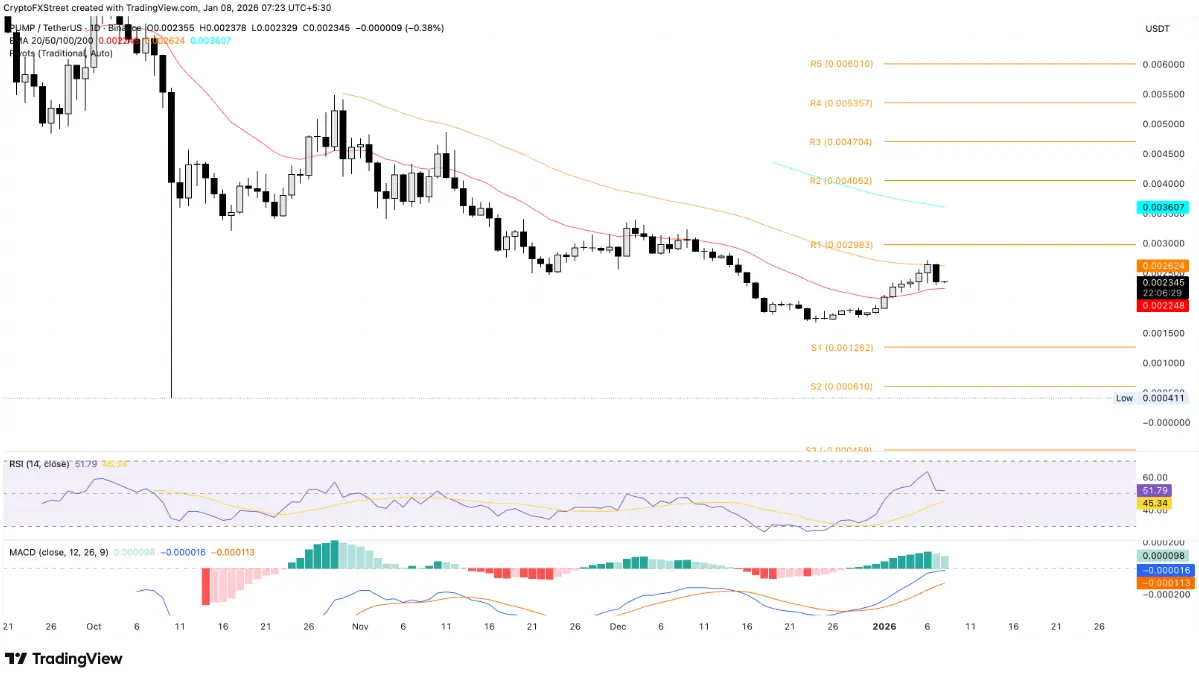 Daily PUMP/USDT chart | Source: TradingView The technical signals on the daily timeframe are warning of weakening demand. The RSI is currently at 51 and trending downward toward the neutral line, reflecting fading bullish momentum. At the same time, the MACD indicator continues to move sideways, with green histogram bars narrowing significantly, indicating a clear decline in bullish strength.
Conversely, if a recovery occurs and PUMP successfully breaks above the 50-day EMA at $0.002624, the price could regain upward momentum and target the resistance zone at the Pivot R1 point, around $0.002983.
Story faces a critical crossroads at the $2.00 mark
As of Thursday when this article was written, Story (IP) is hovering around the $2.00 level, marking its third consecutive decline. The price dropped 2% during the day, following a 4% decrease in the previous session, increasing correction pressure and putting this coin at risk of losing the 20-day EMA at around $1.91.
In a negative scenario, if IP breaks below the support level of $1.91, the decline could extend to the S1 Pivot point near $1.22.
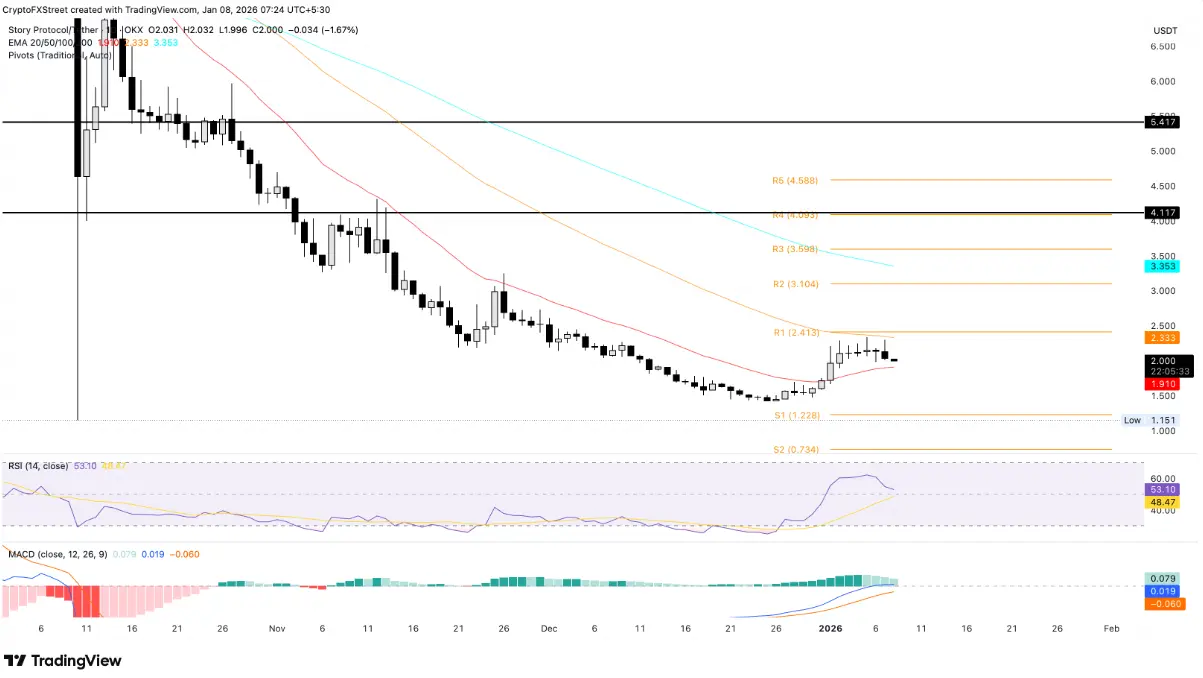 Daily IP/USDT chart | Source: TradingView Similar to PUMP, the technical indicators on the daily timeframe show that buying momentum for Story is weakening significantly. The RSI is currently at 53 and gradually approaching the neutral zone, while the MACD is nearing the signal line, increasing the risk of a bearish crossover — a sign that the correction trend may resume.
On the other hand, to restore bullish prospects, IP needs to decisively break above the 50-day EMA at $2.33. If successful, the price could target the Pivot R1 point around $2.41.
Pudgy Penguins at risk of losing the 50-day EMA
Pudgy Penguins remains resilient above the 50-day EMA at $0.01179, despite a sharp 9% correction on Wednesday. As of this writing, PENGU is fluctuating around $0.01200, close to the short-term resistance at the Pivot R1 level of $0.01193.
However, if the price loses this support zone, selling pressure could increase, pushing PENGU back to test the 20-day EMA at $0.01091 — near the important psychological level of $0.01000.
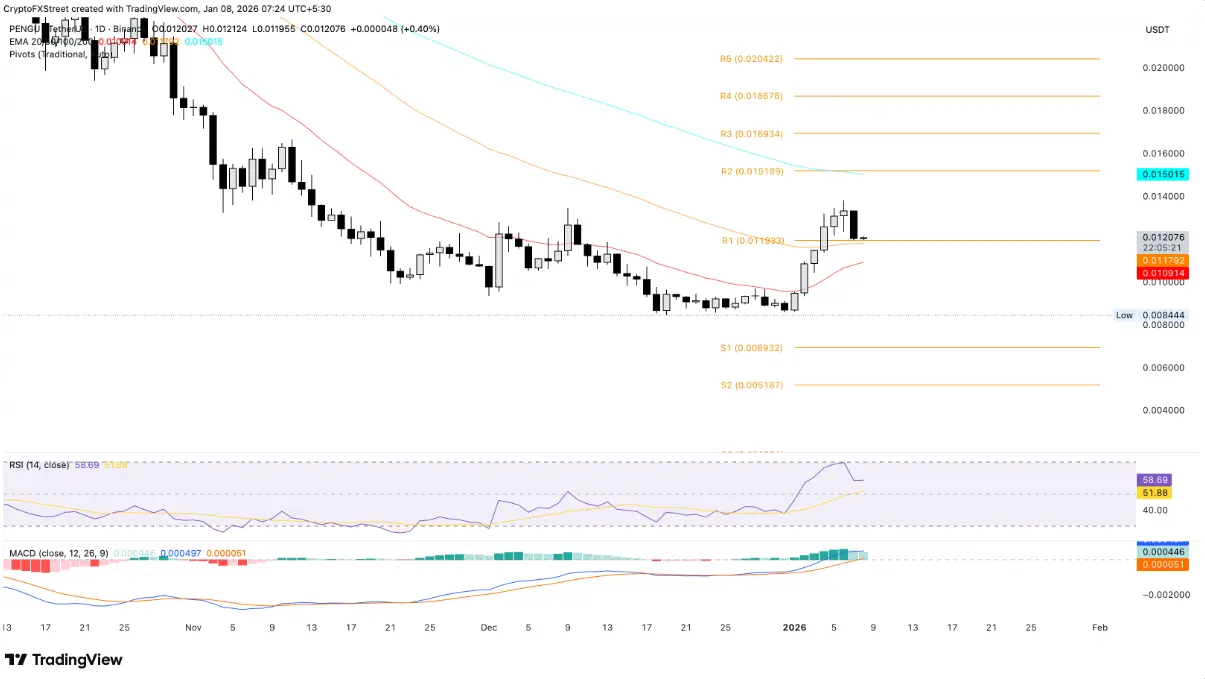 Daily PENGU/USDT chart | Source: TradingView Similar to PUMP and IP, the technical signals on the daily timeframe indicate that Pudgy Penguins’ buying momentum is weakening, implying short-term risks of correction.
In a more positive scenario, if demand returns, PENGU could initiate a recovery toward the next resistance zone at the Pivot R1 level of $0.01518.
Disclaimer: The information on this page may come from third parties and does not represent the views or opinions of Gate. The content displayed on this page is for reference only and does not constitute any financial, investment, or legal advice. Gate does not guarantee the accuracy or completeness of the information and shall not be liable for any losses arising from the use of this information. Virtual asset investments carry high risks and are subject to significant price volatility. You may lose all of your invested principal. Please fully understand the relevant risks and make prudent decisions based on your own financial situation and risk tolerance. For details, please refer to
Disclaimer.
Related Articles
Injective (INJ) Price Down 95% From ATH – Is History Setting Up the Next Bull Run?
Injective (INJ) has declined about 95% from its peak, resembling past crypto cycles that often experience sideways movement before recovery. Current price stabilization suggests accumulation, but a significant rally may be delayed until around October 2026, with ongoing community buybacks supporting demand.
CaptainAltcoin28m ago
Bitcoin dips back below $75,000 on the eve of the Federal Reserve decision
Bitcoin recently touched $75,000 but failed to sustain the level, pulling back to $74,000, reflecting cautious sentiment among investors ahead of the upcoming Federal Reserve interest rate decision. Geopolitical risks and elevated energy prices have driven inflation higher, affecting market expectations for rate cuts and pushing the timeline for cuts to year-end. Technical analysis shows Bitcoin remains strong but has not confirmed a decisive breakout above the $75,000 level, with limited upside potential in the near term.
区块客48m ago
US Treasury yields rose to 4.41%, stock market correction approaching, Bitcoin fell from 90,000 USD to 60,000 USD at one point
Bitcoin has experienced a sharp pullback, with traditional financial markets showing signs of following suit. Rising US Treasury yields are pushing up borrowing costs, leading to decreased risk appetite in the stock market. Bitcoin's price is currently oscillating between $65,000 and $75,000, with market concerns persisting over future volatility. Investors need to monitor the correlation between interest rates and risk assets.
GateNews58m ago
Gold Faces Largest Weekly Decline in 43 Years, Smart Money Pivots to Private Equity and Crypto Assets
Gold experienced its largest single-week decline since 1983 this week, with prices plummeting approximately $600. This decline was primarily driven by a liquidity crisis that forced institutional investors to liquidate positions, rather than weakening safe-haven demand. Capital flows are shifting toward private markets, emerging markets, and digital assets. While the long-term logic for gold has not completely collapsed, it's necessary to observe whether market structure stabilizes.
MarketWhisper1h ago
XRP Price Action Hovers at Critical Support - U.Today
XRP is at a critical support level, with signs of potential reversal indicated by bullish divergence in the RSI. Despite a recent downtrend, strong retail demand is driving accumulation, setting XRP apart in a challenging market.
UToday1h ago
Bitcoin ETF Ends Seven-Day Winning Streak, Bitcoin Price Pressure Returns
US Bitcoin spot ETFs have turned to outflows following seven consecutive trading days of net inflows, indicating a shift toward more conservative capital allocation. Bitcoin price briefly fell below $70,000, reflecting weakened market sentiment and capital flows. ETF outflows stem from market reassessment of the macro environment, as investors reduce risk appetite amid elevated interest rate expectations and geopolitical risks. $70,000 has become a near-term technical dividing line between bulls and bears, with technical indicators suggesting market confidence still needs to be restored.
区块客1h ago
