
**Date: **Wed, Jan 07, 2026 | 10:40 AM GMT
Key Takeaways:
-
Whale Activity: Three wallets linked to a single entity accumulated 3,000 BTC during this week’s price dip.
-
Technical Setup: BTC is forming an Ascending Triangle on the daily chart, a classic bullish continuation signal.
-
Key Levels: Support at $89,900 is the line in the sand; a breakout above $95,000 triggers the $108K target.
The broader cryptocurrency market is showing a mild pullback today after a strong start to the year. Bitcoin (BTC), which had rallied close to the $94,000 mark earlier this week, has cooled off and is now trading below $92,000, down around 1.89% on the day.
While short-term price action reflects some profit-taking, activity beneath the surface tells a different story. Large holders appear to be positioning for a bigger move, and the latest daily chart structure continues to hint at a potential upside resolution.
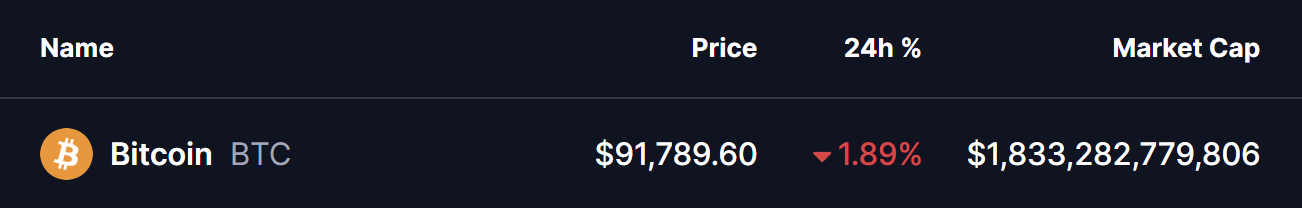
Source: Coinmarketcap
Is This Whale Buying a Sign of the Next BTC Breakout?
As Bitcoin gained momentum over the past several sessions, whales quietly stepped in with significant accumulation. According to data shared by Lookonchain, three wallets — potentially linked to the same entity — accumulated a combined 3,000 BTC worth roughly $280 million just hours ago.
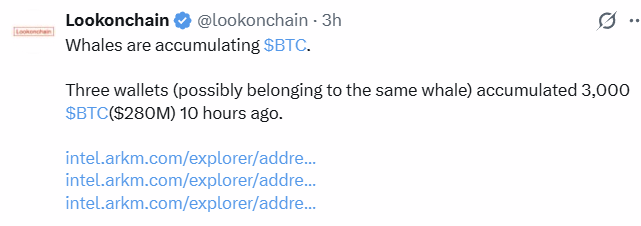
Source: Lookonchain (X)
This type of buying activity during a pullback often suggests long-term conviction rather than short-term speculation.
Ascending Triangle Taking Shape on the Daily Chart
On the daily timeframe, BTC appears to be forming an ascending triangle pattern — a structure commonly associated with bullish continuation when confirmed.
The pattern is defined by a rising trendline that has consistently supported higher lows since December, while price continues to face resistance in the $94,000–$95,000 zone. Each pullback has been increasingly shallow, signaling steady demand at higher price levels.
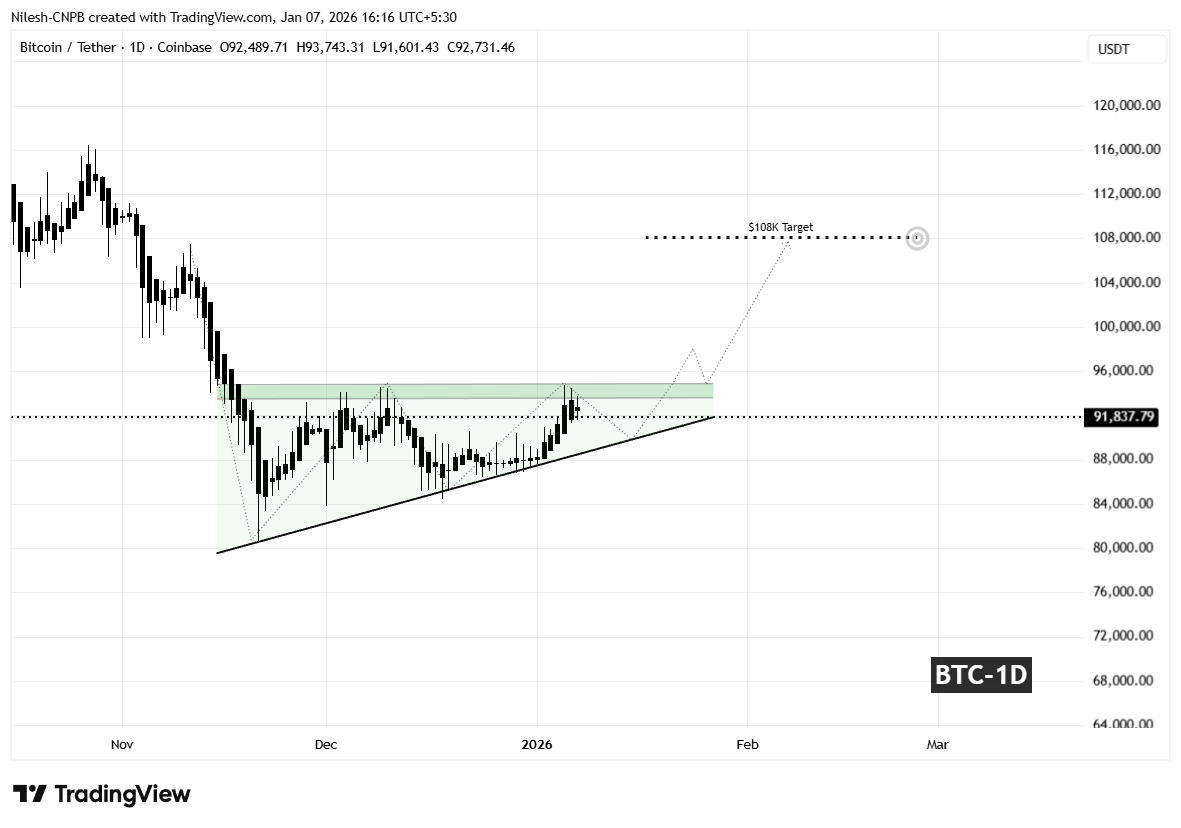
Bitcoin (BTC) Daily Chart/Coinsprobe (Source: Tradingview)
Today’s rejection from resistance pushed BTC back below $92,000, but price remains well above the ascending support trendline. A controlled pullback toward the $89,900–$90,000 area would still keep the broader structure intact and could serve as a healthy reset before the next attempt higher.
Will BTC Hit $108,000? The Scenario Outlook
The $89,000–$90,000 region now plays a crucial role in maintaining bullish structure. As long as BTC continues to hold above this rising trendline, the probability of another move toward the $94,000–$95,000 resistance zone remains elevated.
A decisive daily close above horizontal resistance would confirm an ascending triangle breakout and shift momentum firmly back in favor of the bulls. Such a move could also trigger fresh participation from sidelined buyers.
Based on the measured move projection of the triangle, a confirmed breakout points toward a potential upside target near $108,000 — matching the extension zone marked on the chart. From the breakout area, this would represent roughly a 14% upside move.
On the flip side, failure to hold the ascending support could invalidate the pattern and expose BTC to a deeper corrective move. Until either scenario is confirmed, price action within this structure remains a battle between patient accumulation and short-term selling pressure.
The Bottom Line: While Bitcoin (BTC) has dipped below $92,000, “Smart Money” is using the pullback to load up. On-chain data confirms that three major whales just accumulated $280 million in BTC. Technically, Bitcoin is coiled inside a massive Ascending Triangle, with a confirmed breakout targeting the $108,000 level.
Disclaimer: The views and analysis presented in this article are for informational purposes only and reflect the author’s perspective, not financial advice. Technical patterns and indicators discussed are subject to market volatility and may or may not yield the anticipated results. Investors are advised to exercise caution, conduct independent research, and make decisions aligned with their individual risk tolerance.
About Author: Nilesh Hembade is the Founder and Lead Author of Coinsprobe, with over 5 years of experience in the cryptocurrency and blockchain industry. Since launching Coinsprobe in 2023, he has been providing daily, research-driven insights through in-depth market analysis, on-chain data, and technical research.
Disclaimer: The information on this page may come from third parties and does not represent the views or opinions of Gate. The content displayed on this page is for reference only and does not constitute any financial, investment, or legal advice. Gate does not guarantee the accuracy or completeness of the information and shall not be liable for any losses arising from the use of this information. Virtual asset investments carry high risks and are subject to significant price volatility. You may lose all of your invested principal. Please fully understand the relevant risks and make prudent decisions based on your own financial situation and risk tolerance. For details, please refer to
Disclaimer.
Related Articles
Crypto Market Update – River and DeXe Lead Gains As Political Memecoins Stir Volatility
The crypto market has continued to undergo rapid changes and temporary spurts in specific sectors than many other markets during its most recent period of consolidation. The “Gainers” chart on CoinMarketCap is often reviewed for trends that correlate with major cryptocurrency assets like Bitcoin and
BlockChainReporter4m ago
比特幣力守 7 萬美元!鏈上驚見「集體拋售潮」,散戶成最大賣壓來源
在中東地緣政治緊張的背景下,比特幣遭遇全面拋售,幾乎所有持幣者都轉向淨賣出,以散戶最為明顯。根據Glassnode數據,累積趨勢分數降至0.04,顯示市場賣壓沉重。小額持幣者及中型投資人拋售強度明顯,巨鯨大戶雖然減持,但力度較小。儘管數據慘淡,比特幣仍展現抗跌能力。
区块客37m ago
Shiba Inu Surges 5% as Short Squeeze Drives SHIB Momentum
SHIB rebounded 5% to $0.00000572, reversing a week of losses.
Short sellers faced $38,680 in liquidations, fueling a strong momentum shift.
Technical indicators suggest rising pressure, with resistance at $0.00000587 and support at $0.00000526.
Shiba Inu staged a sharp rebound on
CryptoNewsLand1h ago
Whales holding between 10 and 10,000 BTC increased their holdings, accounting for 68.17% of the total supply.
Santiment report shows that investors holding 10 to 10,000 bitcoins have increased, now controlling 68.17% of the supply. Bitcoin is performing strongly relative to the S&P 500, showing signs of a positive reversal. The S&P 500 has declined 2.2%, while Bitcoin has risen 2.4%.
GateNews2h ago
SHIB Derivatives See 1,549% Jump in Netflows: Is Short Squeeze Brewing? - U.Today
Shiba Inu (SHIB) experienced a 1,549% increase in futures netflows as traders adjusted their positions, with inflows surpassing outflows. Despite a recent price drop, positive on-chain indicators suggest potential for a market rebound if buyers return.
UToday3h ago
On-chain activity is exploding, but Ethereum can't seem to gain momentum? Experts reveal the "fatal weakness": could drop to $1,500
CryptoQuant reports indicate that Ethereum faces an "adoption paradox," where despite network activity reaching new highs, the token price has declined. If the bear market continues, Ether could potentially fall to $1,500 by the end of the third quarter. Smart contract activity has risen while decoupling from Ether's price, with exchange inflows being a better reflection of price dynamics. Weak investment demand and continuous capital outflows remain the primary concern.
区块客3h ago