
**Date: **Wed, Jan 07, 2026 | 06:20 AM GMT
The broader cryptocurrency market continues to show strong New Year momentum, with Bitcoin (BTC) up around 4% and Ethereum (ETH) gaining over 9% on a weekly basis. This improving sentiment is gradually spilling over into major altcoins — including the DePIN-focused token Akash Network (AKT).
AKT has already posted an impressive 20% weekly gain. While this short-term strength has caught traders’ attention, the more important development is unfolding on the higher-timeframe chart. Recent price action suggests a meaningful shift in market structure, hinting that AKT may be transitioning out of a prolonged corrective phase and into the early stages of a bullish continuation.
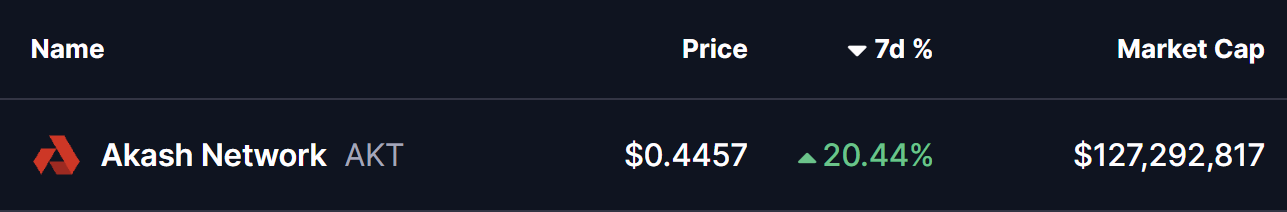
Source: Coinmarketcap
Falling Wedge and Rounding Bottom in Play
On the daily chart, AKT has been trading within a broader falling wedge — a structure that often precedes bullish reversals as selling pressure gradually weakens. Within this larger wedge, price action is also shaping a developing rounding bottom pattern, reflecting steady accumulation and seller exhaustion.
The formation began after AKT faced strong rejection near the $0.5441 resistance zone in late November. That rejection triggered a sharp sell-off, pushing price lower toward the $0.3465 region. However, bears failed to extend losses beyond this area. Instead, demand stepped in, downside momentum slowed, and price began to stabilize.
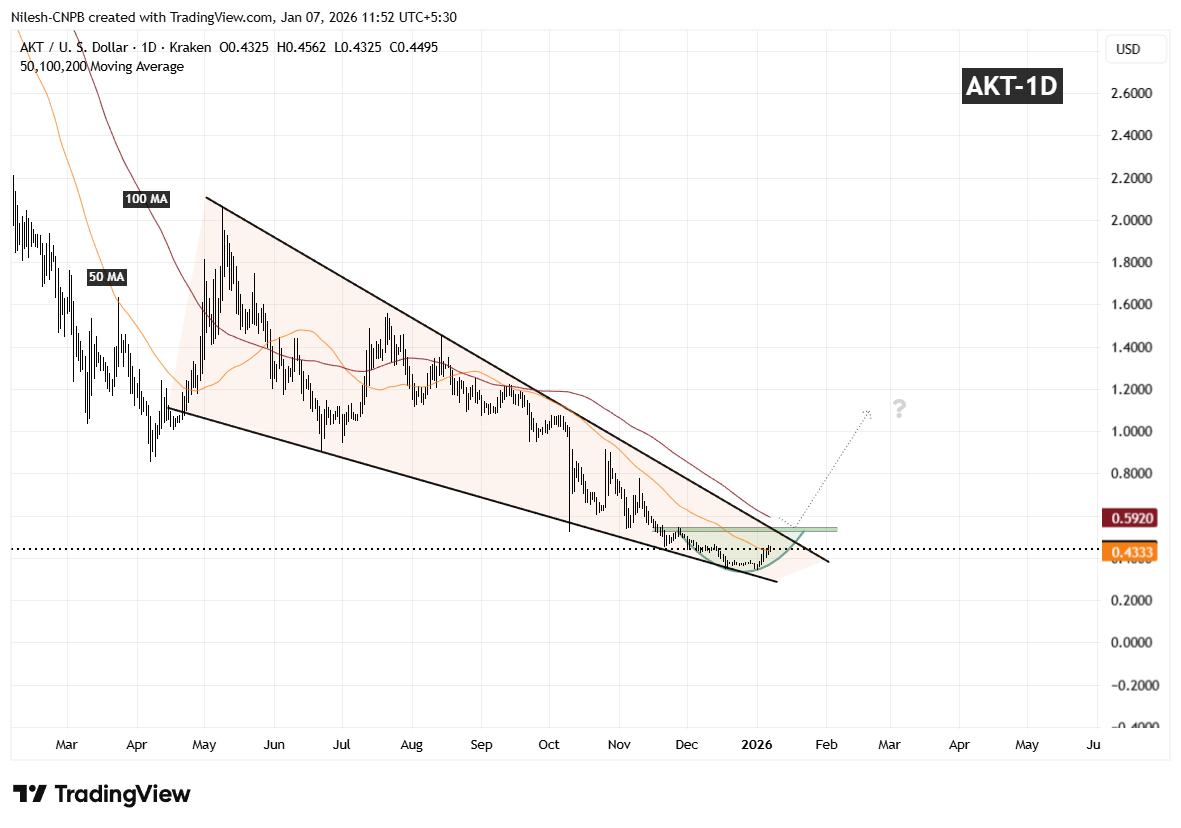
Akash Network (AKT) Daily Chart/Coinsprobe (Source: Tradingview)
Over the following weeks, volatility compressed and AKT started to curl higher in a smooth, rounded fashion — closely matching the textbook behavior of a rounding bottom. Importantly, the recent rebound has pushed price back above the 50-day moving average around $0.4333, a level that had previously acted as resistance and is now beginning to flip into support.
What’s Next for AKT?
If AKT can continue to hold above the 50-day moving average, this area may act as a solid base for further upside attempts. From here, attention shifts toward the descending resistance trendline of the falling wedge, which aligns closely with the $0.5441 resistance zone.
A clean and decisive breakout above this confluence area, followed by sustained acceptance, would confirm a broader bullish expansion phase and mark a clear trend reversal from the prior downtrend. Such a move would likely attract renewed momentum participation as the market recognizes the structural shift.
Until that breakout occurs, the pattern remains in development. Short-term consolidation or shallow pullbacks are still possible as price digests recent gains. However, as long as AKT continues to print higher lows above the established base, the broader technical structure remains constructive.
Overall, the chart suggests AKT is approaching a critical inflection point — one that could determine whether this recovery evolves into a sustained bullish trend as 2026 progresses.
Disclaimer: The views and analysis presented in this article are for informational purposes only and reflect the author’s perspective, not financial advice. Technical patterns and indicators discussed are subject to market volatility and may or may not yield the anticipated results. Investors are advised to exercise caution, conduct independent research, and make decisions aligned with their individual risk tolerance.
About Author: Nilesh Hembade is the Founder and Lead Author of Coinsprobe, with over 5 years of experience in the cryptocurrency and blockchain industry. Since launching Coinsprobe in 2023, he has been providing daily, research-driven insights through in-depth market analysis, on-chain data, and technical research.
Disclaimer: The information on this page may come from third parties and does not represent the views or opinions of Gate. The content displayed on this page is for reference only and does not constitute any financial, investment, or legal advice. Gate does not guarantee the accuracy or completeness of the information and shall not be liable for any losses arising from the use of this information. Virtual asset investments carry high risks and are subject to significant price volatility. You may lose all of your invested principal. Please fully understand the relevant risks and make prudent decisions based on your own financial situation and risk tolerance. For details, please refer to
Disclaimer.
Related Articles
PI Token Maintains Bullish Trend as Anticipation for Pi Day Grows
PI token trades above $0.21 after rallying over 25% in the past 7 days as anticipation for the upcoming Pi Day on March 14 grows.
PiScan recorded 3 million PI deposits to exchanges in 24 hours, suggesting near-term profit taking which could reverse the bullish trend.
Pi Network’s PI token tr
CryptoNewsFlash6m ago
Why Didn't BTC Drop During Geopolitical Conflicts? Answers From Binance's Fund Structure and CVD
The article analyzes the relationship between Binance's BTC balance changes and market demand, indicating that the decrease in BTC balances in the short term is related to genuine demand, especially during the US-Iran conflict. The widening gap in spot trading volume suggests active buying activity, supporting the presence of real demand. Although short-term demand may stabilize BTC prices, the long-term trend still leans downward, and the process of demand recovery could be lengthy.
PANews8m ago
Glassnode Data: Most XRP Supply in Loss, What It Means for Investors
Glassnode data shows 36.8 billion XRP, nearly 60% of the circulating supply, is held at a loss, with unrealized losses reaching $50.8 billion.
XRP traded near $1.34, while futures volume jumped on BitMEX and Binance as ETF outflows and weak spot activity kept pressure on price.
Glassnode dat
CryptoNewsFlash22m ago
23.38% Surge for OGN: What It Means for Investors
OGN's price surged 23.38% in 15 minutes, currently at $0.03356, driven by robust trading volume and market activity. Analysts cite macroeconomic factors and regulatory news influencing investor sentiment, while traders monitor key resistance and support levels.
Coinfomania25m ago
Bitcoin Supply Shock Imminent? Whale Holdings in Dormancy, Retail Selling Intensifies Price Volatility
The Bitcoin market is undergoing structural changes, with short-term holders selling off due to financial pressures, while long-term investors remain dormant, indicating potential supply shocks. Currently, Bitcoin is priced at $69,446, and although some holdings are at a loss, the stability of long-term holders could support the market. Analysts advise paying attention to on-chain indicators and whale activity to evaluate future price trends and liquidity risks.
GateNews39m ago