
**Date: **Mon, Jan 05, 2026 | 10:58 AM GMT
As 2026 kicks off, the broader cryptocurrency market is showing renewed stability. Both Bitcoin (BTC) and Ethereum (ETH) are up more than 6% on the week, and improving sentiment is gradually spreading across major altcoins — including the DeFi heavyweight Aave (AAVE).
AAVE has gained over 8% on a weekly basis, but the more important story is unfolding beneath the surface. While short-term strength is encouraging, the bigger development lies in the broader market structure forming on the higher timeframe. Recent price action suggests a meaningful shift in behavior — one that could mark the early stages of a bullish continuation if key technical levels hold.
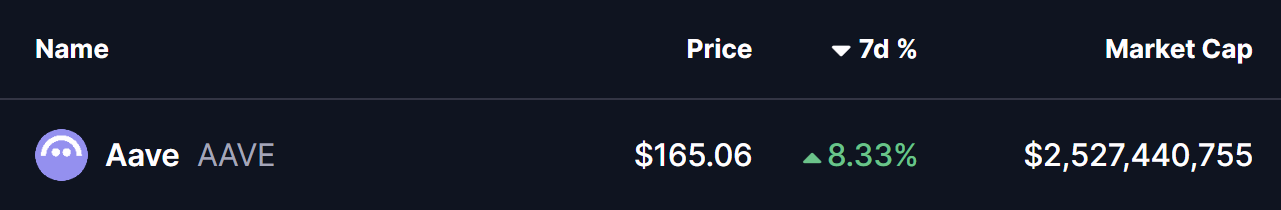
Source: Coinmarketcap
Symmetrical Triangle in Play
On the weekly chart, **AAVE **continues to trade within a symmetrical triangle, a neutral yet powerful pattern that often precedes a major volatility expansion once price approaches its apex.
The structure began forming after AAVE’s strong rally earlier in 2025. However, in August 2025, price faced firm rejection near the triangle’s descending resistance around $385, triggering a sharp corrective move. That pullback resulted in a 62% decline, eventually driving price down toward the triangle’s ascending support trendline near $143.53 last month.
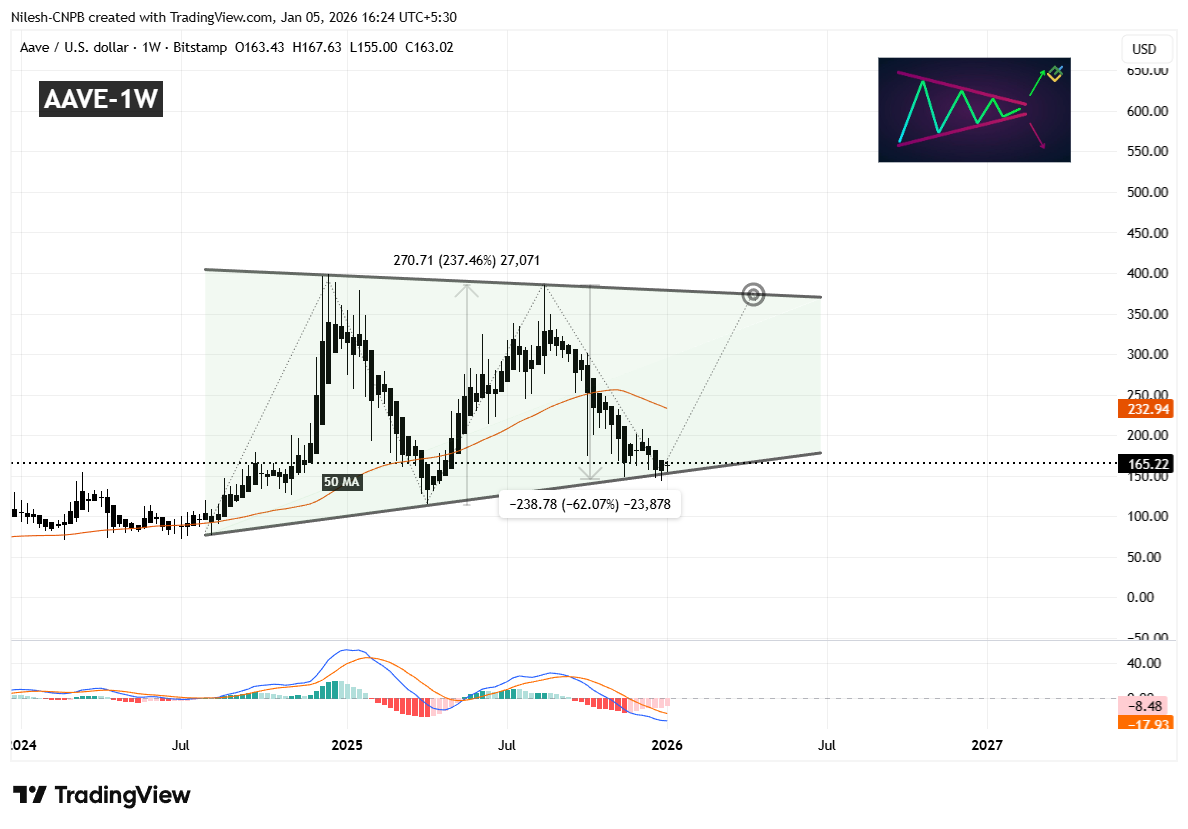
Aave (AAVE) Weekly Chart/Coinsprobe (Source: Tradingview)
Crucially, buyers once again stepped in to defend this long-term support zone. The successful reaction from this level has pushed AAVE back toward the $164 region, signaling renewed buying interest. Notably, this rebound is occurring as the MACD shows early signs of stabilization — a setup that closely resembles conditions seen before AAVE’s previous 237% rally in April 2025.
The next major technical hurdle lies at the 50-week moving average, currently positioned near $232.94. This level has acted as dynamic resistance during the recent decline, and reclaiming it would mark a meaningful shift in medium-term momentum.
What’s Next for AAVE?
If the pattern continues to develop as expected, AAVE could soon attempt a sustained move above the 50-week MA. A confirmed reclaim of this level — followed by acceptance above it — would strengthen the bullish case and increase the probability of a move toward the upper boundary of the triangle near $375.
Such a move would imply a potential upside of roughly 125% from current levels, assuming broader market conditions remain supportive and momentum continues to build.
Until then, patience remains key. Holding above the ascending support trendline is essential for preserving the bullish structure. Any sustained breakdown below this level would weaken the setup and delay the breakout thesis.
For now, the chart suggests AAVE is at a critical inflection point, where compression within the triangle could soon give way to a decisive move — with the direction likely defined by how price behaves around the 50-week moving average.
Disclaimer: The views and analysis presented in this article are for informational purposes only and reflect the author’s perspective, not financial advice. Technical patterns and indicators discussed are subject to market volatility and may or may not yield the anticipated results. Investors are advised to exercise caution, conduct independent research, and make decisions aligned with their individual risk tolerance.
About Author: Nilesh Hembade is the Founder and Lead Author of Coinsprobe, with over 5 years of experience in the cryptocurrency and blockchain industry. Since launching Coinsprobe in 2023, he has been providing daily, research-driven insights through in-depth market analysis, on-chain data, and technical research.
Disclaimer: The information on this page may come from third parties and does not represent the views or opinions of Gate. The content displayed on this page is for reference only and does not constitute any financial, investment, or legal advice. Gate does not guarantee the accuracy or completeness of the information and shall not be liable for any losses arising from the use of this information. Virtual asset investments carry high risks and are subject to significant price volatility. You may lose all of your invested principal. Please fully understand the relevant risks and make prudent decisions based on your own financial situation and risk tolerance. For details, please refer to
Disclaimer.
Related Articles
Bitcoin bull market index rises to 40 points; Bloomberg: the U.S. and Iran are considering extending the ceasefire agreement by two weeks
Bitcoin’s price as of April 16 is approaching $74,700. The Bullish Sentiment Index (BSI) has risen to 40 points, indicating a rebound in market sentiment. The United States and Iran are evaluating options to extend the current ceasefire agreement, and they are also discussing navigation issues in the Strait of Hormuz, as diplomatic negotiations continue.
MarketWhisper55m ago
Bitcoin holds steady at 74K, and FOMO sentiment is heating up as U.S. stocks hit a record high
Benefiting from positive news about the U.S.-Iran peace agreement, the stock market surged sharply, with the Nasdaq index and the S&P 500 index reaching record highs. Bitcoin remained steady at 74K, market sentiment improved, and the Fear & Greed Index rose to 55. Investor FOMO toward the stock market intensified, and the total market capitalization in the crypto market increased overall, indicating genuine buy-side interest.
ChainNewsAbmedia2h ago
Bitcoin Rebounds to $74K on U.S.-Iran Framework Deal, But Market Skepticism Remains
Bitcoin's recent rise to mid-$74,000 followed a risk asset rally linked to a U.S.-Iran nuclear framework, but skepticism remains due to flat Treasury yields and unchanged gold prices. The core issue of uranium enrichment persists, and while on-chain data shows BTC's gradual advance, options markets reflect doubts about a sustained breakout. Overall, analysts see the rally as temporary, with macro conditions still tight and potential downside risks.
GateNews14h ago
Cardano Traders Watch $0.243 Support Level as ADA Price Faces Critical Decision
Cardano (ADA) is at a crucial support level of $0.243, with potential gains to $0.30 if it holds. A daily close below this could lead to declines toward $0.10. Currently, trading volume is around $500 million, with ADA notably below its all-time high.
GateNews16h ago
ETH/BTC Price Ratio Rebounds to 0.0313 in Q1 2026 as Ethereum User Base Surges 82%
In Q1 2026, the Ethereum-to-Bitcoin price ratio reached a three-month high at 0.0313. Ethereum added 284,000 users and surpassed $180 billion in stablecoin supply. Bitcoin remained strong above $74,000, driven by significant ETF inflows.
GateNews21h ago
