
Key Takeaways
-
Hyperliquid (HYPE) surged over 8%, reclaiming the $23.30 level amid rising market interest.
-
DefiLlama data shows Hyperliquid leading perpetual futures volume over the last 30 days, topping $160 billion.
-
Strong derivatives activity suggests sustained trader demand and growing ecosystem traction.
-
The daily chart highlights a Bearish Shark harmonic pattern, allowing room for short-term upside.
Hyperliquid’s native token, HYPE, is back in the spotlight today after posting a 8%+ price jump, pushing above the $23.30 level. While the price move itself has caught traders’ attention, a deeper look at on-chain metrics and the daily chart suggests there may be more developing beneath the surface.
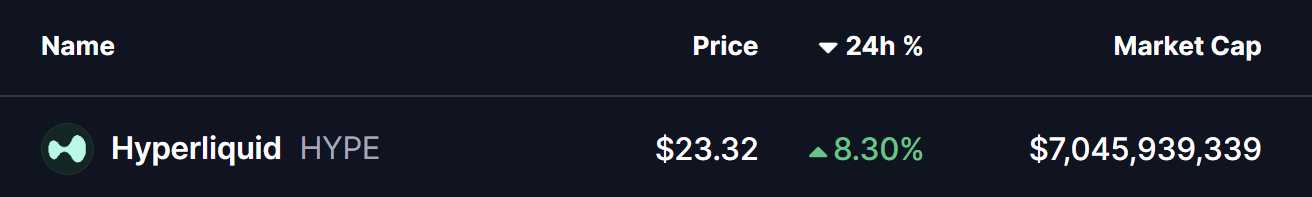
Source: Coinmarketcap
Hyperliquid (HYPE) Leads Perp Volume
According to DefiLlama data, **Hyperliquid **has emerged as the **top perpetual futures **platform by trading volume over the last 30 days, significantly outperforming its closest competitors. The protocol recorded approximately $160.4 billion in perpetual volume, comfortably ahead of Aster and Lighter, which logged around $124.7 billion and $112.5 billion, respectively.
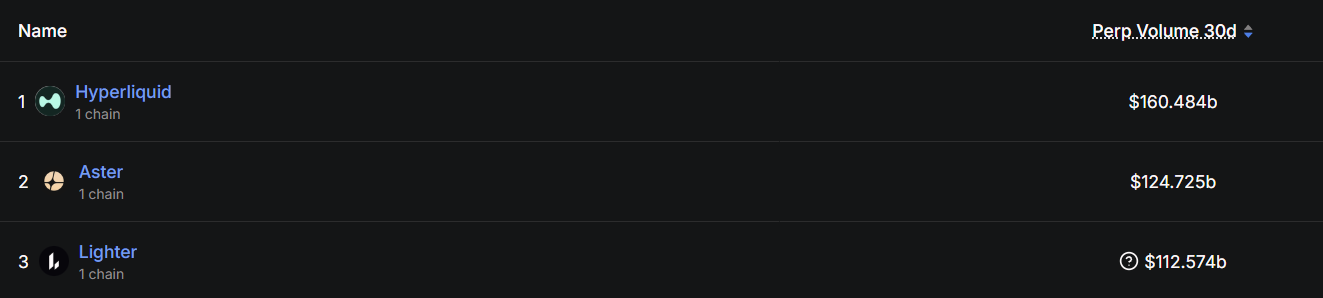
Source: Defillama
This surge in activity highlights growing trader preference for Hyperliquid’s ecosystem, signaling strong demand, deep liquidity, and sustained engagement. Historically, rising derivatives volume often acts as a leading indicator for increased interest in a project’s native token — something that appears to be playing out in HYPE’s recent price action.
Is More Upside Ahead?
From a technical perspective, HYPE’s daily chart reveals the development of a Bearish Shark harmonic pattern, a well-known formation in technical analysis. While this pattern ultimately suggests a potential reversal once fully completed, it often allows for short-term bullish continuation as price moves toward the “C” point.
Following the completion of the O-X-A-B structure, HYPE is currently trading around $23.26, holding above its recent lows. The next key challenge for bulls lies at the 50-day moving average near $25.72, which has acted as a dynamic resistance zone.
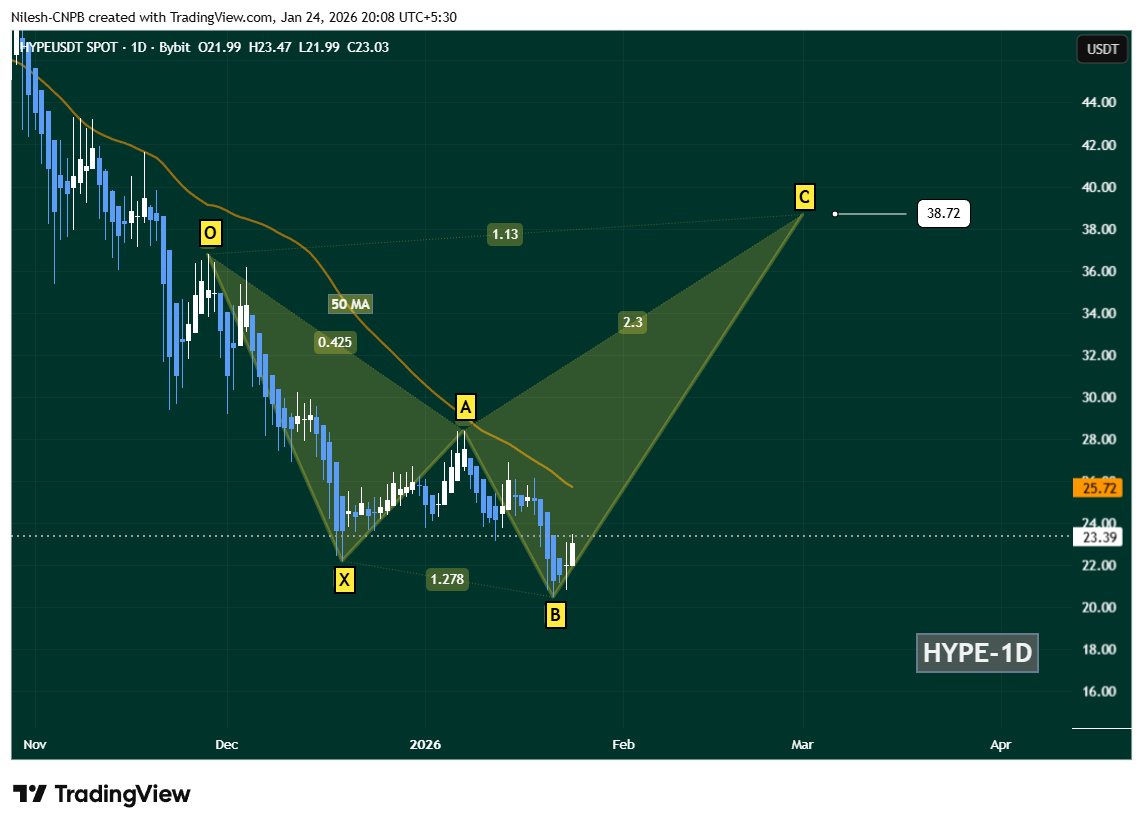
Hyperliquid (HYPE) Daily Chart/Coinsprobe (Source: Tradingview)
A decisive daily close above the 50-day MA ($25.72) would strengthen the recovery narrative and could open the door for a broader upside move. If momentum continues to build, the chart projects a potential advance toward the C-point near $38.72, aligning with the Shark pattern’s 1.13 Fibonacci extension.
However, downside risks remain. A failure to hold the B-point support zone would invalidate the bullish continuation setup and could expose HYPE to extended consolidation or further downside pressure in the near term.
Bottom Line
HYPE’s price rebound is being backed by strong on-chain fundamentals, with Hyperliquid clearly dominating the perpetual trading landscape. While the broader harmonic structure suggests caution in the longer term, short-term technicals still favor a recovery move as long as key support levels remain intact. All eyes now remain on the $25.72 reclaim, which could act as the trigger for the next leg higher.
Disclaimer: The views and analysis presented in this article are for informational purposes only and reflect the author’s perspective, not financial advice. Technical patterns and indicators discussed are subject to market volatility and may or may not yield the anticipated results. Investors are advised to exercise caution, conduct independent research, and make decisions aligned with their individual risk tolerance.
About Author: Nilesh Hembade is the Founder and Lead Author of Coinsprobe, with over 5 years of experience in the cryptocurrency and blockchain industry. Since launching Coinsprobe in 2023, he has been providing daily, research-driven insights through in-depth market analysis, on-chain data, and technical research.
Disclaimer: The information on this page may come from third parties and does not represent the views or opinions of Gate. The content displayed on this page is for reference only and does not constitute any financial, investment, or legal advice. Gate does not guarantee the accuracy or completeness of the information and shall not be liable for any losses arising from the use of this information. Virtual asset investments carry high risks and are subject to significant price volatility. You may lose all of your invested principal. Please fully understand the relevant risks and make prudent decisions based on your own financial situation and risk tolerance. For details, please refer to
Disclaimer.
Related Articles
Trader Eugene: Switched to long positions, multiple altcoins showing arc bottom formations
Trader Eugene Ng Ah Sio stated on March 16 that he would shift to a long position, believing that despite weakening global risk assets, the crypto market is performing strongly. He pointed out that the probability of a short-term rally is high and expects Bitcoin breaking through $74,000 to drive a market-wide recovery.
GateNews35m ago
XRP Price Breaks Through Key Resistance Level to $1.48, Trading Volume Surges Over 250%
On March 16, XRP price broke through the consolidation zone, rising rapidly from approximately $1.41 to $1.4798, with trading volume increasing over 250%. The current price is stabilizing above $1.4550, and technical analysis shows the next resistance level at $1.48 to $1.50. On-chain activity is also growing, indicating improved market sentiment and increased activity. Key support levels are at $1.43 to $1.44.
GateNews36m ago
Bitcoin Surges to Local High of 74,000 USD, US-Iran Conflict and Oil Rally Drive Crypto Market's 320 Billion Dollar Spike
Bitcoin's price briefly surged to $74,451 on March 16, reaching a 40-day high, influenced by US-Iran conflicts and rising oil prices. The market has gained over $320 billion in total, but uncertainties still exist. Analysts suggest dollar-cost averaging between $60,000 and $70,000. Investors should exercise caution to manage potential risks.
GateNews39m ago
XRP Trading Volumes Fall 58% in 24 Hours, Despite Which the Altcoin Price Continues to Rise
XRP trading volumes fall 58% in 24 hours.
Despite this, the altcoin price continues to rise at a steady pace.
This bodes well for the likelihood of a possible XRP pump.
The previous few days have led to what looks to be a steady recovery phase for the crypto market. Presently, the price
CryptoNewsLand39m ago
Bitcoin Holds Strong at $70,000! On-Chain Data Reveals "Collective Selling Wave," Retail Investors Emerge as Biggest Selling Pressure
Under Middle East geopolitical tensions, Bitcoin faced widespread selling pressure, particularly from retail holders. According to Glassnode data, the market is experiencing heavy selling pressure, with the accumulated trend score declining to 0.04, indicating that retail and small-to-medium investors are reducing their positions significantly. Despite this, Bitcoin's resilience against the decline has surprised market observers.
区块客45m ago
Ethereum Breaks Through $2,200 Mark: ETF Inflows and Institutional Buying Drive ETH Strong Rebound
Ethereum (ETH) price broke through $2,200 following a recent rebound, with intraday gains of approximately 4.1%. ETF inflows and institutional buying support the rally, with key resistance levels at $2,250-$2,320. If it breaks through $2,300-$2,400, it could potentially point toward $2,500. Overall, this shows Ethereum's market recovery potential.
GateNews50m ago
