Key Takeaways
-
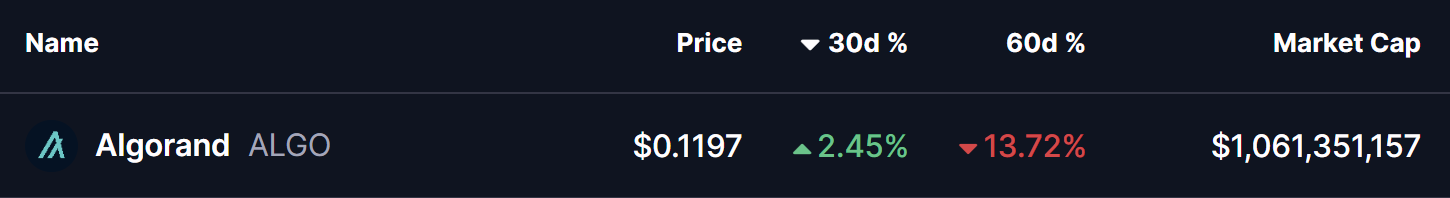
Algorand (ALGO) is consolidating after a 13% decline over the past 60 days, while showing stabilization in the last month.
-
The daily chart reveals a repeating bullish fractal, similar to the setup that triggered ALGO’s 300% rally in November 2024.
-
Price is holding inside a long-term accumulation zone between $0.11 and $0.1530.
-
The 200-day moving average near $0.1912 is acting as key resistance and breakout confirmation level.
-
A successful reclaim of the 200 MA could open the path toward $0.60 and the ascending resistance trendline, while a drop below $0.11 would invalidate the bullish setup.
ALGO, the native token of Algorand’s Layer-1 blockchain, has shown steady but muted momentum over the past 30 days, helping slow down its broader correction. Despite this stabilization, ALGO remains down more than 13% over the last 60 days, keeping sentiment cautious across the market.
That said, when looking beyond short-term price noise, the daily chart is beginning to tell a familiar story. The current structure closely resembles a bullish fractal that, in the past, preceded a powerful breakout rally—raising an important question for traders: is this just consolidation, or a quiet accumulation phase before the next move?
Source: Coinmarketcap
Fractal Setup Hints at a Bullish Reversal
On the daily timeframe, ALGO is displaying early signs of a repeating bullish structure, built around three key technical elements:
-
A rejection from the long-term ascending resistance trendline
-
A prolonged accumulation zone at major historical support
-
A potential reclaim of the 200-day moving average
The current corrective phase began in December 2024, when ALGO was rejected near the ascending resistance trendline around $0.60. That rejection triggered a deep pullback of more than 80%, eventually driving price back into the long-term demand zone between $0.11 and $0.1530—a region that has repeatedly acted as an accumulation area on the chart.
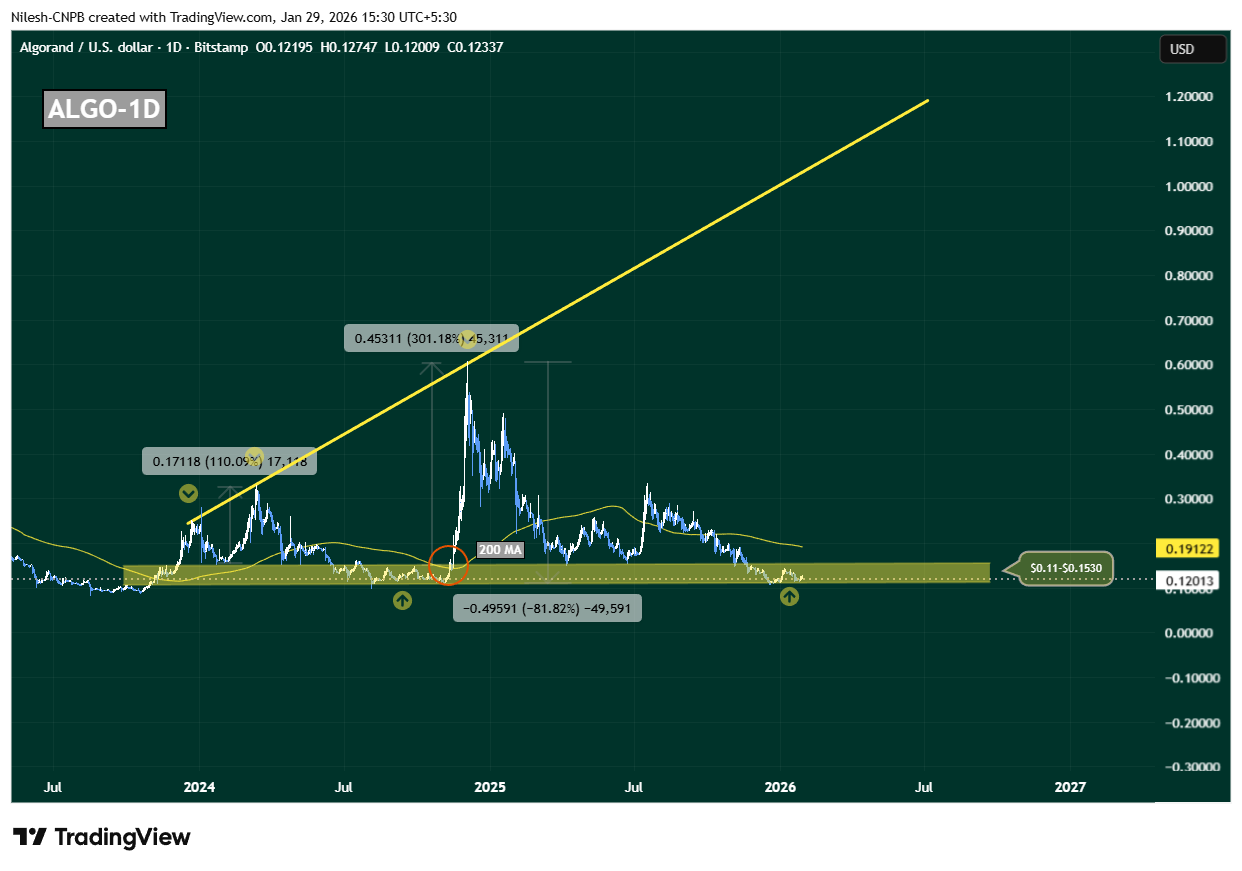
Algorand (ALGO) Daily Chart/Coinsprobe (Source: Tradingview)
This zone is not just technically important; it has also served as a launchpad during previous cycles, where downside momentum stalled and long-term buyers quietly stepped in.
History Rhymes on the ALGO Chart
What makes this setup particularly compelling is how closely it mirrors November 2024’s breakout structure. Back then, ALGO spent extended time consolidating near the same support band before reclaiming the 200-day moving average. Once that level flipped into support, price accelerated sharply—resulting in a 300% rally toward the ascending resistance trendline.
Today, ALGO is once again compressing inside this accumulation range, while the 200-day moving average sits overhead near $0.1912, acting as dynamic resistance. This alignment suggests the market may be approaching another inflection point.
What’s Next for ALGO?
At present, ALGO is hovering near $0.12, firmly inside its long-term accumulation zone. As long as price holds above this region, the broader bullish fractal remains intact.
A clean and sustained reclaim of the 200-day moving average around $0.1912 would be a critical confirmation signal. If bulls manage to flip this level into support, it would closely replicate previous breakout conditions and could trigger a sharp upside expansion. In that scenario, $0.60 becomes a realistic medium-term target, with further upside possible toward the ascending resistance trendline if momentum builds.
However, the structure is not without risk. A decisive breakdown below $0.11 would weaken the accumulation thesis, signal loss of long-term support, and open the door for deeper downside.
For now, ALGO sits at a make-or-break zone. The chart suggests patience is key—but if history repeats, this quiet phase may not last much longer.
Disclaimer: The views and analysis presented in this article are for informational purposes only and reflect the author’s perspective, not financial advice. Technical patterns and indicators discussed are subject to market volatility and may or may not yield the anticipated results. Investors are advised to exercise caution, conduct independent research, and make decisions aligned with their individual risk tolerance.
About Author: Nilesh Hembade is the Founder and Lead Author of Coinsprobe, with over 5 years of experience in the cryptocurrency and blockchain industry. Since launching Coinsprobe in 2023, he has been providing daily, research-driven insights through in-depth market analysis, on-chain data, and technical research.
Disclaimer: The information on this page may come from third parties and does not represent the views or opinions of Gate. The content displayed on this page is for reference only and does not constitute any financial, investment, or legal advice. Gate does not guarantee the accuracy or completeness of the information and shall not be liable for any losses arising from the use of this information. Virtual asset investments carry high risks and are subject to significant price volatility. You may lose all of your invested principal. Please fully understand the relevant risks and make prudent decisions based on your own financial situation and risk tolerance. For details, please refer to
Disclaimer.
Related Articles
Liệu RAVE có sẵn sàng tăng 30% sau khi lấy lại được mức hỗ trợ này?
RaveDAO (RAVE) hiện đang giao dịch ở mức $0,2475 sau khi ghi nhận mức tăng ấn tượng 16,45%. Đáng chú ý, sự gia tăng mạnh mẽ trong hoạt động thị trường đã được ghi nhận, với khối lượng giao dịch tăng vọt 125%, đạt $88,15 triệu. Điều này phản ánh sự quan tâm lớn từ các nhà đầu tư và nhà giao dịch đối
TapChiBitcoin13m ago
+112 Billion Shiba Inu (SHIB) in 24 Hours Returns Notorious 80 Trillion Threshold - U.Today
Shiba Inu finally recovering
Shiba Inu are ready to sell
More than 112 billion SHIB tokens were transferred to exchanges in the past day, bringing total exchange reserves back above the 80 trillion SHIB threshold, indicating a discernible change in Shiba Inu's on-chain dynamics.
Shiba Inu final
UToday14m ago
Solana Tests $90 Resistance as Fibonacci Confluence Signals Key Turning Point
Key Insights
Solana price is nearing a major resistance near $90 where Fibonacci retracement and value area levels align, creating a decisive technical barrier.
Market structure shows the rally forming part of an ABC corrective pattern, keeping the broader consolidation intact while price tr
CryptoFrontNews36m ago
一周精选丨告别“龙虾”狂欢,回归加密本源,Hyperliquid是本周最热项目
PANews编者按:PANews精选了一周的优质内容,帮助大家利用周末时间查漏补缺,点击标题即可阅读。
宏观视角
a16z:致加密创始人,企业不买最好的技术
区块链创始人如何向企业销售?本文揭示企业不买“最好”技术,而选择破坏最小的升级路径。结合真实案例,分享将区块链技术包装成企业可接受方案的关
马斯克最新访谈:AI已进入自我进化循环,人类正从“回路”中消失
马斯克在科技峰会透露,特斯拉擎天柱3人形机器人即将投产,AI已进入自我改进阶段。他预测未来经济将高速增长并转向通缩,商品服务产出远超货币供给,甚至预言“钱不再重要”。
对话Bitwise首席信息官:量子计算与AI威胁被夸大,
PANews1h ago
今日加密货币恐慌与贪婪指数升至 16,市场仍处极度恐慌状态
Gate News 消息,3 月 14 日,Alternative.me 数据显示,今日加密货币恐慌与贪婪指数为 16,较昨日的 15 小幅上升 1 个点,市场情绪仍处于「极度恐慌状态」。
GateNews2h ago
Luke Gromen Says 'Nuclear Printing' Needed to Push Bitcoin Back Into Bull Market
Bitcoiners often argue that BTC should thrive when the global financial system starts to look unstable. But Luke Gromen says that this time, BTC simply was not behaving the way he thought it should, and that was enough for him to slash a position he described as “irresponsibly large.”
Gromen
Coinpedia5h ago