
Key Takeaways
-
NEAR is forming a potential double bottom pattern near the $1.40 support zone.
-
Holding above $1.40 keeps the bullish reversal scenario intact.
-
A breakout above $1.87 could confirm the pattern and trigger a stronger recovery.
The broader cryptocurrency market has once again slipped into a corrective phase after a strong start to the year. Bitcoin (BTC), which recently surged above the $95,000 mark, has pulled back sharply and is now trading below $88,000. Ethereum (ETH) has faced even heavier pressure, sliding nearly 10% over the past week — a move that has weighed on major altcoins across the board.
Near Protocol (NEAR) hasn’t been spared either. The token is currently down around 6% on the week. However, beneath the surface, NEAR’s price action is beginning to show a familiar and potentially bullish setup — one that could hint at a bounce back if key levels hold.
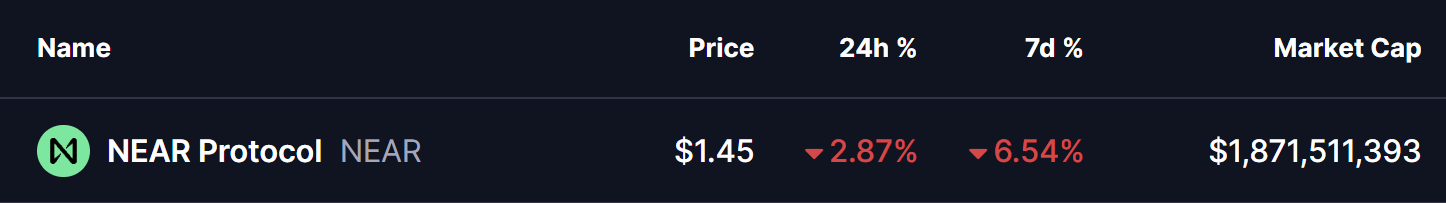
Source: Coinmarketcap
Double Bottom Pattern in Play?
On the daily timeframe, NEAR appears to be forming a potential double bottom pattern, a well-known bullish reversal structure that often emerges near the end of extended downtrends.
The first bottom formed when NEAR dropped toward the $1.40 region, followed by a recovery attempt that pushed price back toward the neckline resistance around $1.87. That move, however, faced rejection, sending NEAR back down to retest the same $1.40 support zone.
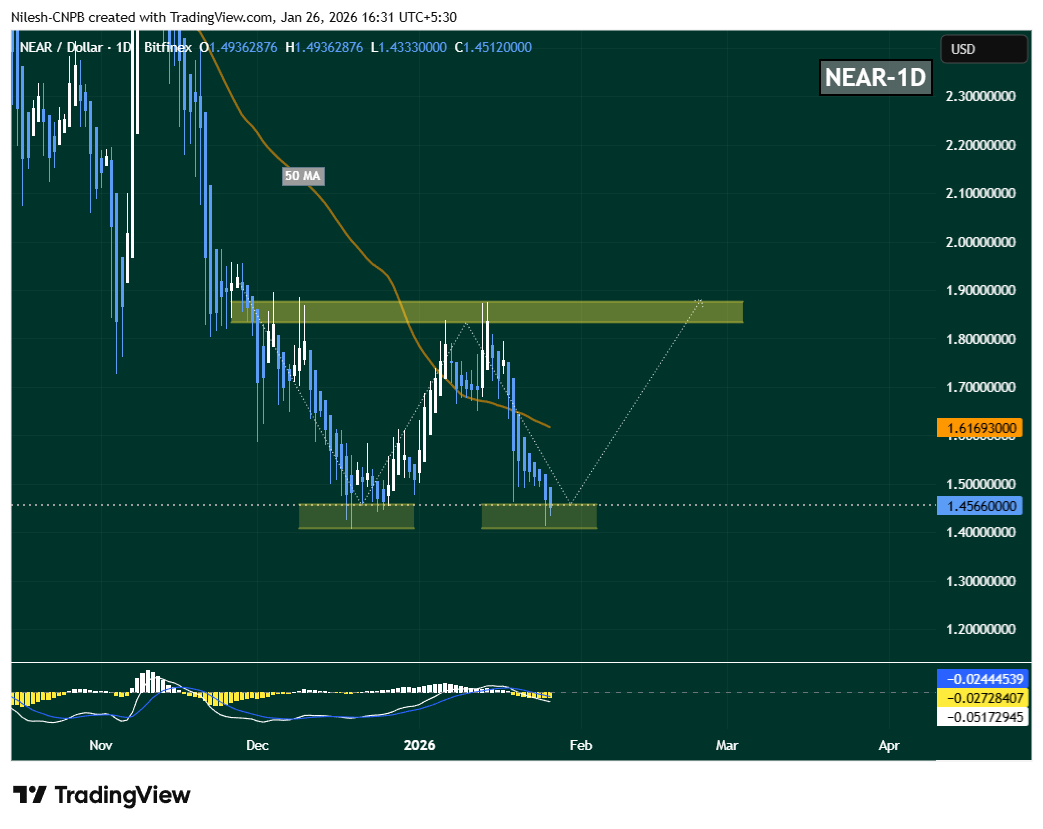
Near Protocol (NEAR) Daily Chart/Coinsprobe (Source: Tradingview)
What stands out is that buyers stepped in once again at this level. NEAR has so far held above this support and is currently trading near $1.45, signaling that selling pressure may be weakening. Adding to this setup, the MACD indicator is beginning to hint at a possible bullish crossover — often an early signal that momentum could start shifting in favor of the bulls.
What’s Next for NEAR?
For this bullish structure to gain traction, NEAR needs to reclaim the 50-day moving average, which sits near $1.6169. A sustained move above this level would mark an important shift in short-term momentum and increase the odds of a continued recovery toward the neckline resistance at $1.87.
A decisive breakout above that neckline — ideally followed by a successful retest — would confirm the double bottom pattern and potentially open the door for a stronger upside move.
On the downside, the $1.40 support zone remains the most critical level to watch. A failure to hold this area would invalidate the bullish setup and expose NEAR to deeper downside risk.
Overall, NEAR’s structure appears constructive. The repeated defense of identical lows, the developing double bottom, and price hovering near the 50-day moving average suggest that the token could be approaching a pivotal moment — one where accumulation transitions into a potential recovery phase if broader market conditions stabilize.
Disclaimer: The views and analysis presented in this article are for informational purposes only and reflect the author’s perspective, not financial advice. Technical patterns and indicators discussed are subject to market volatility and may or may not yield the anticipated results. Investors are advised to exercise caution, conduct independent research, and make decisions aligned with their individual risk tolerance.
About Author: Nilesh Hembade is the Founder and Lead Author of Coinsprobe, with over 5 years of experience in the cryptocurrency and blockchain industry. Since launching Coinsprobe in 2023, he has been providing daily, research-driven insights through in-depth market analysis, on-chain data, and technical research.
Disclaimer: The information on this page may come from third parties and does not represent the views or opinions of Gate. The content displayed on this page is for reference only and does not constitute any financial, investment, or legal advice. Gate does not guarantee the accuracy or completeness of the information and shall not be liable for any losses arising from the use of this information. Virtual asset investments carry high risks and are subject to significant price volatility. You may lose all of your invested principal. Please fully understand the relevant risks and make prudent decisions based on your own financial situation and risk tolerance. For details, please refer to
Disclaimer.
Related Articles
「刻舟求劍」式幣價預測走紅,玄學預言的實戰邏輯與缺陷
作者:Frank,PANews
每當市場進入不上不下的迷惘階段,就會有人試圖用「刻舟求劍」式的歷史回溯方法去預測下一段走勢。在這種情況下,人們往往能從這些理論和圖表中看到歷史總是在重演,並似乎自動將未來一段時間的行情走勢與過去的某一段進行重疊驗證。
這種重合似乎有著神奇的效果,也常常被驗證。有部落客自稱這種預測的準確率能到達 75%~80% 。
這種在社群媒體上屢屢爆紅的「刻舟求劍」式價格預測,究竟是在幫助市場識別階段,還是在把噪音包裝成預言?
從「滴答分形」到「歷史押韻」
關於 2025 年 10 月市場頂點預測的巔峰操作是名為 CryptoBullet 的分析師,他所創建的一種名為「ti
区块客40m ago
Dogecoin (DOGE) Prints Abnormal $0 as Short Sellers Disappear - U.Today
Dogecoin's recent rally saw $0 in short liquidations, indicating traders were betting long. Despite a 4.61% decline due to market pullback, volume remained high. The potential for DOGE to reach $0.10 depends on Bitcoin's recovery.
UToday1h ago
Bitcoin Holds Steady Amid Middle East Escalation
Bitcoin demonstrates resilience at $70K amid geopolitical tensions in the Middle East, with declining exchange-held Bitcoin indicating investor confidence. Market reactions reflect a growing stability, despite volatility from conflict risks.
CryptoFrontNews1h ago
Liệu Dogecoin có chững lại trong một phạm vi giá kéo dài nhiều tuần bất chấp đợt tăng giá 15%?
Dogecoin (DOGE) has successfully defended the crucial support level of $0.088 despite recent selling pressure, aided by Bitcoin's recovery. While DOGE saw a significant 15% increase recently, long-term trends remain bearish. Rising social media interactions and potential short liquidations could drive short-term growth, but long-term recovery may require surpassing $0.127.
TapChiBitcoin2h ago
Analyst Says XRP Is ‘Criminally Undervalued’ as RSI Drops
Analyst says XRP RSI reached oversold levels last seen during the 2022 bear market bottom.
XRP trades near $1.39 with key support at $1.30–$1.35 and resistance between $1.45 and $1.70.
Price has declined from about $3.10 since Sept 2025, forming a prolonged downward trend.
XRP trades near
CryptoFrontNews3h ago
Shiba Inu Death Cross Appears on Daily Chart as Price Loses Support - U.Today
Shiba Inu (SHIB) is battling bearish pressure that threatens to undo its over 8.85% weekly gains. In the last 24 hours, the meme coin’s price and volume flipped negative as it recorded a death cross on its charts.
Death cross signals weakening momentum for Shiba Inu
For context, a death cross eme
UToday3h ago