
Monero had a tough day even in a market that was already under stress. Over the last 24 hours, the XMR price dropped around 11.29%, much more than the broader crypto market, which fell about 5.17%.
A mix of regulatory worries, risk-off sentiment, and a clear technical breakdown all hit at once, and sellers didn’t hesitate. This wasn’t caused by one headline or one bad candle. It was a combination of factors lining up in the worst way.
- Regulatory Fears Are Back in Focus
- A Weak Market Didn’t Help
- What the XMR Chart Is Telling Us
- What’s Next for Monero?
Regulatory Fears Are Back in Focus
Every time regulators mention privacy coins, Monero is the first one that gets affected. The renewed focus on privacy coins reignited concerns about exchange access and liquidity. After previous delistings in key regions and ongoing policy discussions, traders are already sensitive to this kind of news.
That nervousness showed up quickly in price action. Once sentiment turned, many holders chose to step aside rather than wait to see how things develop. In environments like this, the XMR price usually reacts fast once confidence cracks.
Stop Staring at the HBAR Chart: This Is Why Hedera Wins When Volatility Hits_**
A Weak Market Didn’t Help
Zooming out, Monero was not alone. The entire crypto market was under pressure, and fear was the prevailing sentiment, with Bitcoin falling below significant levels. During risk-off periods, it is mostly the high-risk altcoins that take the hit, and Monero was no exception.
Liquidity added to the pain. Since the level of trade activity was low, as soon as selling picked up, there were not enough buyers around to absorb the fall. That’s how relatively small pushes can turn into sharp drops in the XMR price.
What the XMR Chart Is Telling Us
The chart makes the situation pretty clear. Early on, the XMR price tried to hold above the $460 level, which had acted as solid support through much of January. Once that floor gave way, selling accelerated.
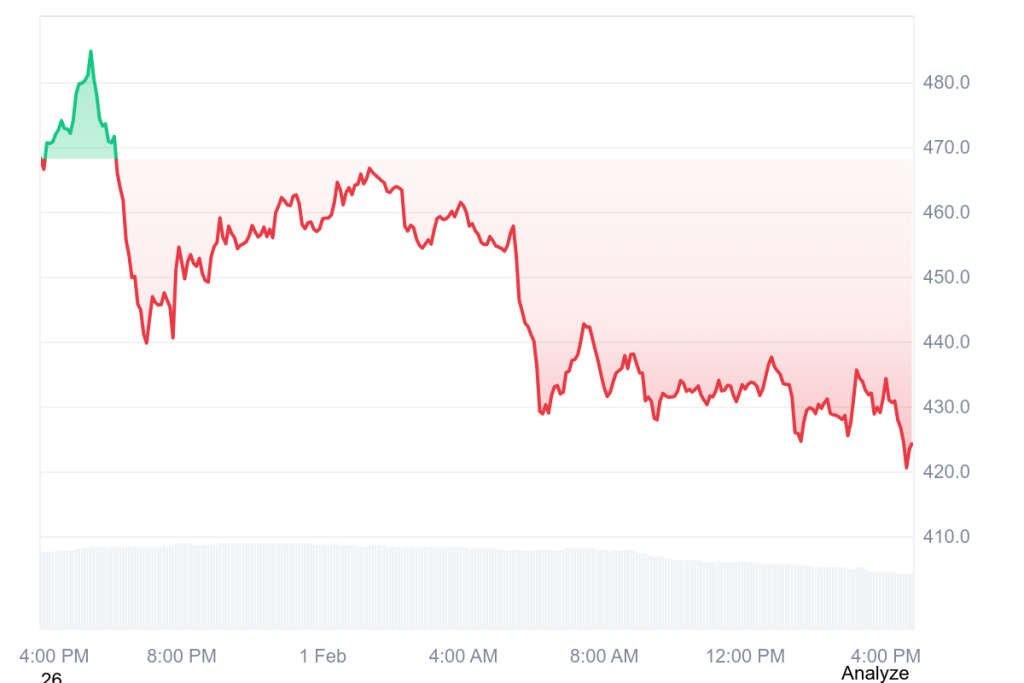
Source: CoinMarketCap/XMR
The XMR price slid from the mid-$460s down into the low $420s without much of a fight. Attempts to bounce were weak and failed quickly, creating a string of lower highs. Volume picked up during the drop, which usually points to urgency from sellers rather than a calm pullback.
Momentum indicators also rolled over. RSI fell into the mid-30s, showing strong downside pressure but not the kind of exhaustion that forces an immediate bounce. With $460–$480 now overhead resistance, the chart doesn’t show much support until the $400–$420 area.
What’s Next for Monero?
This sharp drop doesn’t mean Monero has to keep falling nonstop, but it does change the short-term outlook. As long as the XMR price stays below $460, sellers remain in control. Any bounce that stalls under that level is likely to face pressure again.
For now, Monero’s move is a reminder of how quickly sentiment can turn around privacy coins when regulation and market fear collide. The next few sessions will be important, especially to see whether buyers step in around the $400–$420 zone or continue to stay on the sidelines.
Disclaimer: The information on this page may come from third parties and does not represent the views or opinions of Gate. The content displayed on this page is for reference only and does not constitute any financial, investment, or legal advice. Gate does not guarantee the accuracy or completeness of the information and shall not be liable for any losses arising from the use of this information. Virtual asset investments carry high risks and are subject to significant price volatility. You may lose all of your invested principal. Please fully understand the relevant risks and make prudent decisions based on your own financial situation and risk tolerance. For details, please refer to
Disclaimer.
Related Articles
Will XRP Hold $1.33 or Extend Toward $1.30 Before Rebound?
XRP is currently trading at $1.35, experiencing a 1.3% decline. Key support is at $1.34, while resistance is at $1.40. The price is testing around the Fibonacci levels of $1.33 and $1.30, crucial for potential upward movement or deeper decline.
CryptoNewsLand27m ago
Dogecoin Monthly Breakdown Pattern Reappears as Price Tests $0.0918
Dogecoin is currently trading at $0.09205 at a gain of 2.3, with support of above $0.08878.
As can be seen in the monthly chart, there are recurring breakdown areas that have been followed by significant expansions in price.
The short-term trading range is narrow and the immediate point o
CryptoNewsLand30m ago
Solana Nears $95 Resistance With $17B Volume Surge
Solana approaches a key resistance level near $95, with increased trading volume and open interest signaling active trader interest. The token is currently at $90.20, facing potential upward movement if it surpasses $95, but may test $85 if rejected.
CryptoFrontNews55m ago
Bitcoin Slips to $68,000 as Middle East Conflict and US Jobs Data Trigger Sell-Off
Bitcoin surrendered its $70,000 support level, triggering a broader crypto market retreat that wiped out $329 million in leveraged positions. This downturn was fueled by a perfect storm of geopolitical and macroeconomic pressures.
Wiping out the ‘War Gains’
Bitcoin’s midweek resilience
Coinpedia56m ago
PEPE Hovers at Critical $0.053414 Support as $432M Volume Surge Tightens Breakout Watch
PEPE is trading at $0.053416, just above support at $0.053414, with significant trading volume up 22.14%. Resistance is at $0.053676. Despite a slight decrease in price, there’s increased market activity, suggesting potential volatility.
CryptoNewsLand1h ago
DXY Retest at 99.183: Will 100–101 Break as US Degen Index Stabilizes?
DXY trades at 99.183 while retesting the 100–101 monthly resistance zone.
US Degen Index 6900 sits at $0.0001197 with support at $0.0001175 and resistance at $0.0001214.
A break above 101 on DXY would shift structure higher, while rejection keeps price below key resistance.
The U.
CryptoNewsLand1h ago