Bitcoin Cash (BCH) continues to decline in the red, trading below the $522 mark at the time of writing on Tuesday, after a series of unsuccessful attempts to conquer key resistance levels. Signals from the derivatives market and on-chain data indicate growing bearish sentiment, reflecting selling pressure still dominating. Notably, this picture also raises the possibility of a short-term technical rebound—often called a dead-cat bounce—before the price faces the risk of falling further, heading toward lower support zones.
Derivatives and on-chain indicators signal negative outlook
Data from the Bitcoin Cash derivatives market are sending unfavorable signals. According to CoinGlass, the BCH long/short ratio on Tuesday is only 0.90. The fact that this indicator remains below 1 suggests bearish sentiment is prevailing, with most traders leaning toward short positions and betting on a price decline.
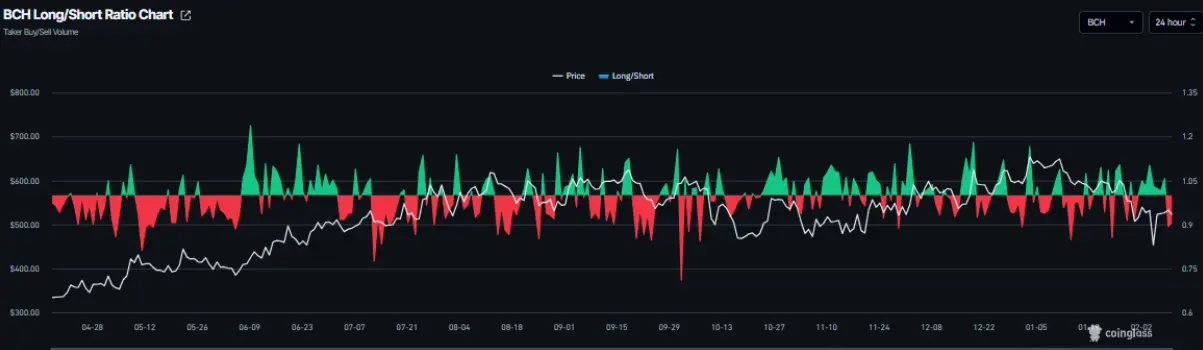 BCH long/short ratio chart | Source: Coinglass The negative outlook is further reinforced by aggregated data from CryptoQuant. Both the spot and futures markets for BCH show selling pressure dominating, increasing the risk of a short-term correction.
Bitcoin Cash price forecast: “dead-cat bounce” scenario in play
The price of Bitcoin Cash (BCH) repeatedly faces strong resistance at the 61.8% Fibonacci retracement zone around $534.80, established from the decline starting at the peak of $603.90 on January 27 down to the bottom of $423.00 on February 6. Notably, this area nearly coincides with the broken upward trendline as well as the 200-day EMA at $544.70, forming a key resistance zone.
Current developments suggest BCH may be undergoing a technical rebound (dead-cat bounce), reflecting a short-term recovery amid a still-weak downtrend. As of Tuesday, the coin is fluctuating around $525.40.
In a negative scenario, if selling pressure continues to increase, BCH could retreat further to the daily support zone at $478.70.
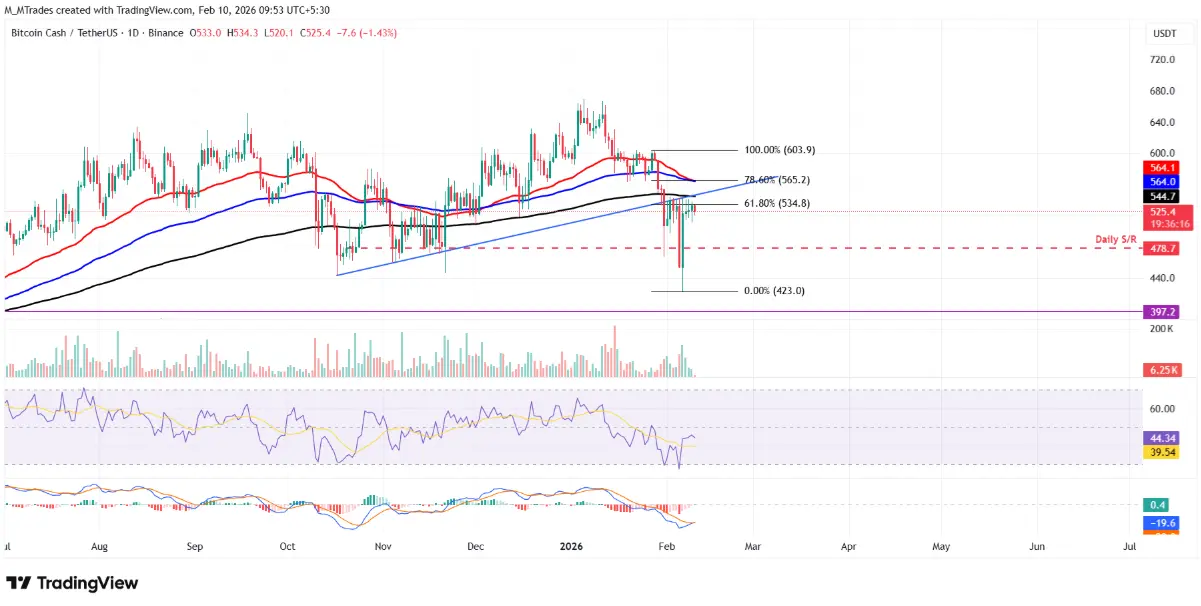 Daily BCH/USDT chart | Source: TradingView Momentum indicators continue to signal caution. The RSI is at 44, below the neutral 50 level and trending downward, indicating selling pressure is gaining strength. Meanwhile, MACD lines are narrowing, raising expectations of a potential bullish crossover. However, if this signal is not confirmed, the downtrend is likely to persist, increasing the risk of deeper correction.
Conversely, if BCH can rally and close firmly above the 200-day EMA at $544.70, the recovery could extend toward the nearest resistance zone around $564.00—where the 100-day EMA converges.
Disclaimer: The information on this page may come from third parties and does not represent the views or opinions of Gate. The content displayed on this page is for reference only and does not constitute any financial, investment, or legal advice. Gate does not guarantee the accuracy or completeness of the information and shall not be liable for any losses arising from the use of this information. Virtual asset investments carry high risks and are subject to significant price volatility. You may lose all of your invested principal. Please fully understand the relevant risks and make prudent decisions based on your own financial situation and risk tolerance. For details, please refer to
Disclaimer.
Related Articles
Iran Bitcoin Hashrate Drops 77% Amid Ongoing Conflict
Iran’s Bitcoin mining industry has taken a sharp hit. New data shows the country’s hashrate has dropped by 77% in just one quarter. Reports suggest Iran has lost around 7 exahashes per second. Its total hashrate now sits near 2 EH/s. Compared to past levels, when the nation had built a robust mining
Coinfomania45m ago
BTC 15-minute decline of 0.52%: Exchange inflows and whale selling converge, triggering short-term pressure
2026-04-08 14:30 to 2026-04-08 14:45(UTC), BTC spot return recorded -0.52%, with a price range of 70922.5 to 71512.2 USDT and a swing of 0.83%. During the event, market liquidity faced pressure; short-term volatility drew market attention, showing dynamic shifts between the funds side and the positions side.
The main driver behind this abnormal move is the increase in exchange capital inflows and the whale’s large transfers being sold off. On-chain data shows that within 10 minutes, about 6.5 BTC were transferred into exchanges, with a clear increase, reflecting that some of the capital is accelerating the rotation between the fund side and the positions side.
GateNews45m ago
Bitcoin drops below 71,000 USDT, with a 1.29% intraday decline
Gate News message: On April 8, according to some CEX price data, Bitcoin fell below 71,000 USDT and is currently trading at 70,997.66 USDT, with a daily decline of 1.29%.
GateNews51m ago
BTC 跌破 71000 USDT
Gate News bot 消息,Gate 行情显示,BTC 跌破 71000 USDT,现价 70994.2 USDT。
CryptoRadar57m ago
Iran requires oil tankers to pay Bitcoin tolls for the Strait of Hormuz: where geopolitics and cryptocurrency intersect
Iran has set up a tiered toll system in the Strait of Hormuz, requiring tankers to pay a toll of $1 per barrel in RMB or cryptocurrency. This move is reshaping global energy trade and the cryptocurrency market landscape.
InstantTrends1h ago
Adam Back: Bitcoin’s quantum threat is still far off, but the migration window has already opened
Blockstream CEO Adam Back said in an interview that quantum computers have not yet threatened the Bitcoin network, but the industry needs to prepare in advance by migrating keys to a quantum-resistant format. He mentioned that his research team is pushing forward on related work; post-quantum cryptography has already entered the implementation stage. The challenge faced is how to complete the migration in an orderly way.
GateNews2h ago
