Maple Finance (SYRUP) is hovering around the $0.2700 USD mark at the time of recording on Friday, as buying pressure persistently protects the S1 Pivot support zone at $0.2497 USD. The steady price maintenance indicates that market sentiment is gradually stabilizing after recent fluctuations.
From an on-chain data perspective, demand for this DeFi protocol remains positive. Total Assets Under Management (AUM) has surpassed $4 billion USD, while revenue continues to hold steady after reaching a record high in January — a sign reinforcing investor confidence in the platform.
On the technical side, SYRUP is signaling a potential recovery as selling pressure appears to weaken, opening room for a new upward move if demand continues to be sustained.
Maple Finance Maintains Revenue, Attracts Whales
Data from Dune Analytics dashboards show that Maple Finance has generated $1.46 million USD in revenue so far this month, after hitting a record high of $2.57 million USD — mostly from lending activities and yield optimization strategies. This trend follows steady monthly growth, after the protocol recorded $2.49 million USD in December.
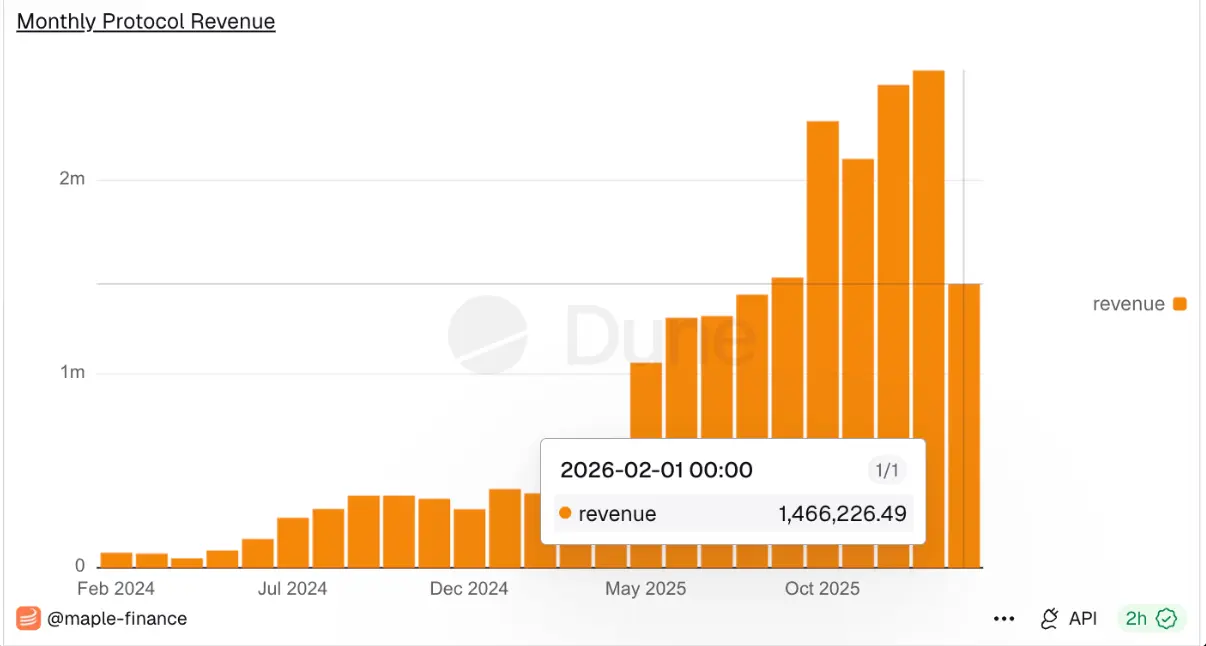 Monthly Revenue of Maple Finance | Source: Dune
Meanwhile, Maple Finance’s total assets under management (AUM) have exceeded $4 billion USD, with lending debt reaching $1.08 billion USD. The combination of stable revenue streams and expanding asset scale indicates that the protocol’s ecosystem is accelerating, benefiting from continuously rising market demand.
Monthly Revenue of Maple Finance | Source: Dune
Meanwhile, Maple Finance’s total assets under management (AUM) have exceeded $4 billion USD, with lending debt reaching $1.08 billion USD. The combination of stable revenue streams and expanding asset scale indicates that the protocol’s ecosystem is accelerating, benefiting from continuously rising market demand.
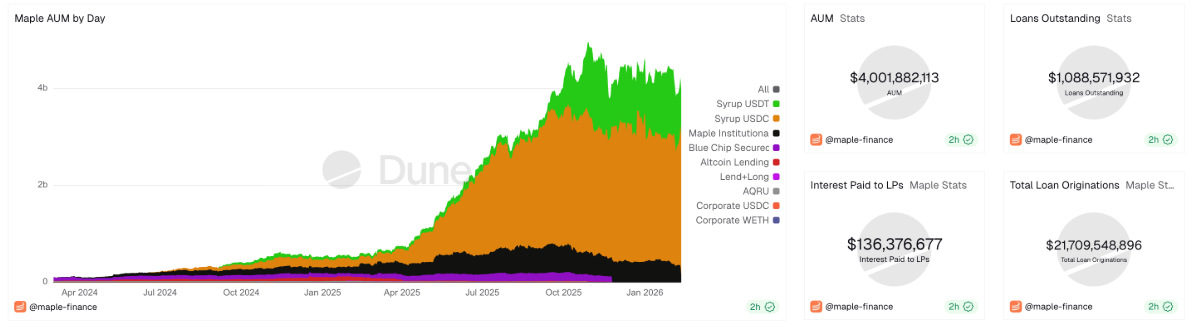 Maple Finance’s Total Assets Under Management (AUM) Data | Source: Dune
Further supporting this positive outlook, data from CryptoQuant shows stable interest from large investors — often called “whales” — as reflected by the average size of SYRUP orders in the spot market, indicating that significant capital is quietly accumulating.
Maple Finance’s Total Assets Under Management (AUM) Data | Source: Dune
Further supporting this positive outlook, data from CryptoQuant shows stable interest from large investors — often called “whales” — as reflected by the average size of SYRUP orders in the spot market, indicating that significant capital is quietly accumulating.
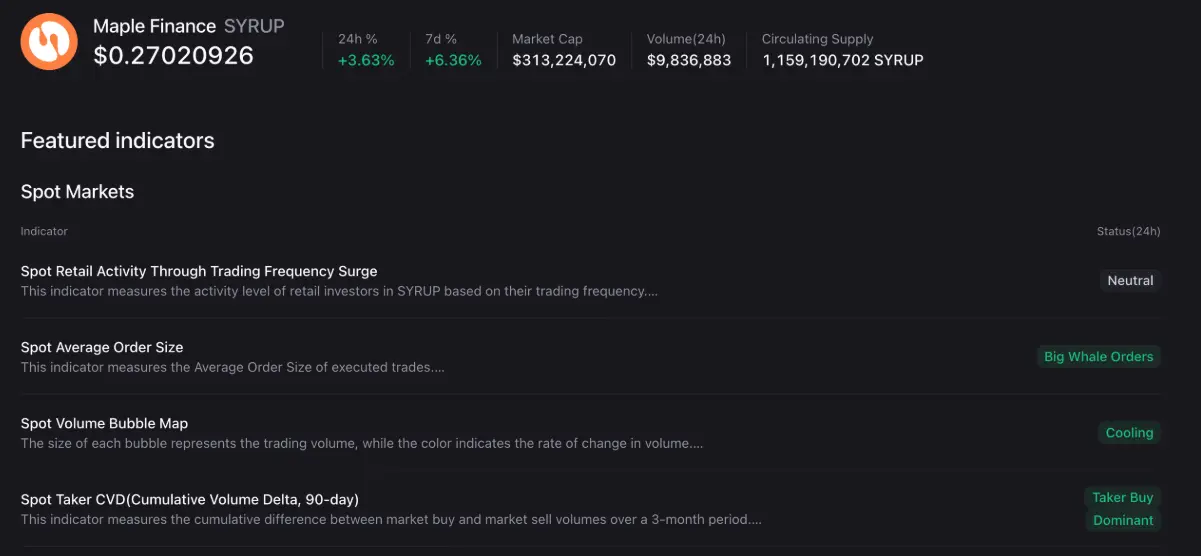 Spot Market Indicators for SYRUP | Source: CryptoQuant
Technical Outlook: Can SYRUP Recover in a Downtrend Channel?
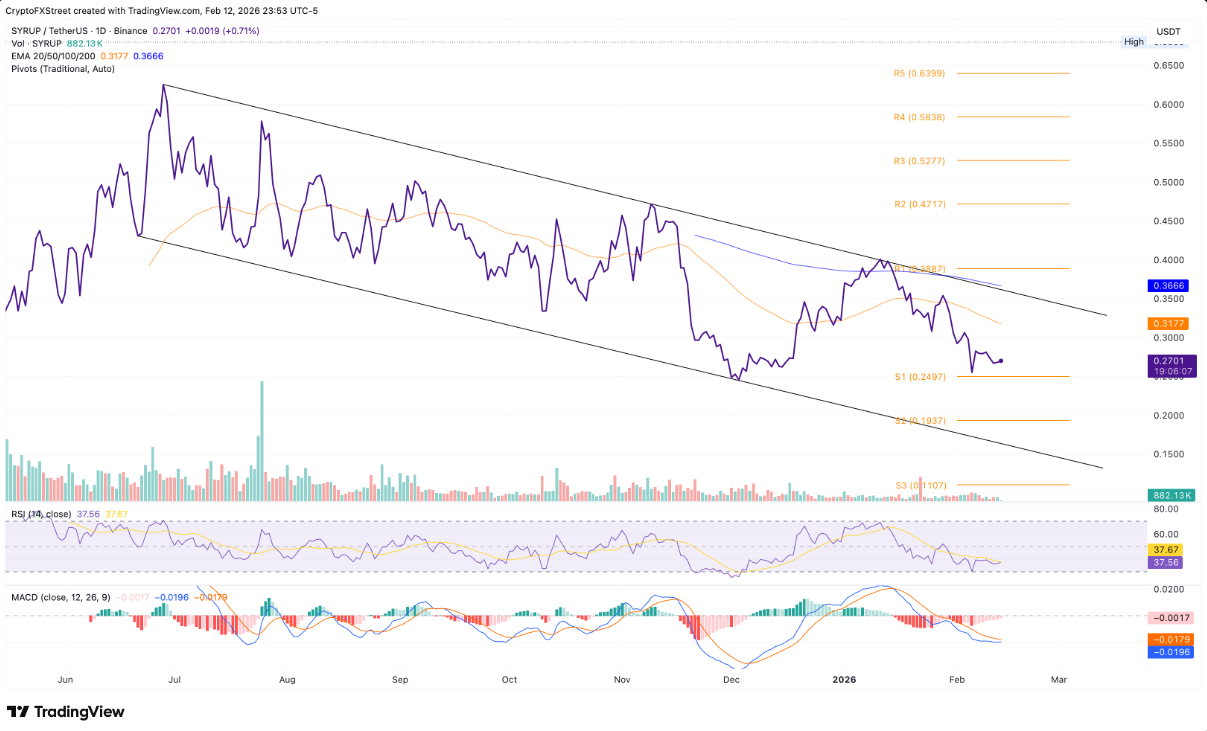
Maple Finance currently trades just above the S1 Pivot level at $0.2497 USD — a short-term support buffer formed after a 31-day decline that saw SYRUP lose about 35% of its value. This movement clearly reflects a downward trajectory within a larger descending channel pattern, established by two parallel trendlines on the daily timeframe.
Conversely, a technical rebound could see SYRUP testing the 50-day Exponential Moving Average (EMA) at $0.3176 USD, before aiming for the 200-day EMA at $0.3666 USD — an area coinciding with the upper boundary of the price channel and serving as a key resistance level.
 Daily SYRUP/USDT Chart | Source: TradingView
Technical signals suggest selling pressure is gradually weakening. The RSI currently hovers around 36, remaining above the oversold zone and sideways after a deep decline, implying that selling momentum is no longer overwhelming. Additionally, the MACD line is approaching the signal line as the histogram’s negative side narrows, increasing the likelihood of a bullish crossover — a potential short-term reversal indicator.
Daily SYRUP/USDT Chart | Source: TradingView
Technical signals suggest selling pressure is gradually weakening. The RSI currently hovers around 36, remaining above the oversold zone and sideways after a deep decline, implying that selling momentum is no longer overwhelming. Additionally, the MACD line is approaching the signal line as the histogram’s negative side narrows, increasing the likelihood of a bullish crossover — a potential short-term reversal indicator.
However, a negative scenario should still be considered. If SYRUP closes below the $0.2497 USD level, selling pressure could intensify, pushing the price down toward the S2 Pivot at $0.1937 USD.
Disclaimer: The information on this page may come from third parties and does not represent the views or opinions of Gate. The content displayed on this page is for reference only and does not constitute any financial, investment, or legal advice. Gate does not guarantee the accuracy or completeness of the information and shall not be liable for any losses arising from the use of this information. Virtual asset investments carry high risks and are subject to significant price volatility. You may lose all of your invested principal. Please fully understand the relevant risks and make prudent decisions based on your own financial situation and risk tolerance. For details, please refer to
Disclaimer.
Related Articles
XRP Reclaims $1.40 Mark as Price Jumps 6%, Where Is Price Heading? - U.Today
XRP recently surpassed the $1.40 resistance level, driven by a 12.92% spike in trading volume to $2.63 billion. Renewed interest, notably due to a partnership with Mastercard, may help sustain upward momentum, with potential targets of $1.50 and $2. However, a drop below $1.39 could negate this breakout.
UToday30m ago
PI Jumps 16% After V20.2 Upgrade and AI Node Plans
Pi Network completed the V20.2 upgrade, ensuring node alignment and network stability for all operators.
AI node experiments tested decentralized computing, using spare node capacity to handle real AI tasks.
PI price jumped 16%, breaking resistance at $0.23, eyeing $0.28 as key target.
P
CryptoNewsLand1h ago
"Seeking a Sword by Marking a Boat" style coin price predictions go viral: the practical logic and flaws of mystical prophecies
Author: Frank, PANews
Whenever the market enters a confusing phase of stagnation, someone attempts to predict the next trend using a "cutting the cord at the boat" style of historical retrospection method. In such circumstances, people often see from these theories and charts that history is repeating itself, and seem to automatically overlap and verify future market movements with a certain period in the past.
This coincidence appears to have a magical effect and is often verified. Some bloggers claim that the accuracy rate of this type of prediction can reach 75%~80%.
Does this "cutting the cord at the boat" style price prediction that repeatedly goes viral on social media actually help the market identify phases, or is it packaging noise as prophecy?
From "Tick Fractals" to "History Rhymes"
The peak operation regarding the prediction of a market top in October 2025 comes from an analyst named CryptoBullet, who created a method called "tick
PANews1h ago
Bitcoin Holds Strong at $70,000! On-Chain Data Reveals "Collective Selling Wave," Retail Investors Emerge as Biggest Selling Pressure
Under Middle East geopolitical tensions, Bitcoin faced widespread selling pressure, particularly from retail holders. According to Glassnode data, the market is experiencing heavy selling pressure, with the accumulated trend score declining to 0.04, indicating that retail and small-to-medium investors are reducing their positions significantly. Despite this, Bitcoin's resilience against the decline has surprised market observers.
区块客1h ago
Bitcoin Early Warning of Stock Market Risk? Global Stock Market Turbulence Intensifies After BTC Drops to $60,000
Recently, analysts have pointed out that Bitcoin's price movements often lead traditional risk assets, reflecting the weakness in global stock markets. After experiencing volatility, Bitcoin is currently stabilizing around $70,000, with market sentiment being affected by geopolitical tensions and rising oil prices. Historical data shows that Bitcoin often exhibits signs of peaking before stock market corrections, and investors are beginning to regard it as an important indicator for monitoring risk asset sentiment.
GateNews2h ago
Analyst: Bitcoin Has Transitioned from Distribution Phase to Accumulation Phase, Selling Pressure Drops to One-Sixth of Cycle Average
CryptoQuant analysts indicate that the market is currently in a neutral accumulation phase, with selling pressure dropping to historic lows, but may face long-term consolidation risks, requiring attention to the lack of price catalysts.
GateNews2h ago