The sharp increase in on-chain activity has made XRP price predictions a focal point, with data showing that over 1.05 million payments were made between different wallets on Saturday. This is an increase of 200,000 compared to last Wednesday, indicating a significant surge in the usage of the XRP Ledger. However, despite the spike in network activity, XRP has fallen 6.7% in the past 24 hours, dropping back to $2.04 after briefly rising to higher levels last week.
1.05 million payment innovation high: Institutional layout or whales fleeing?
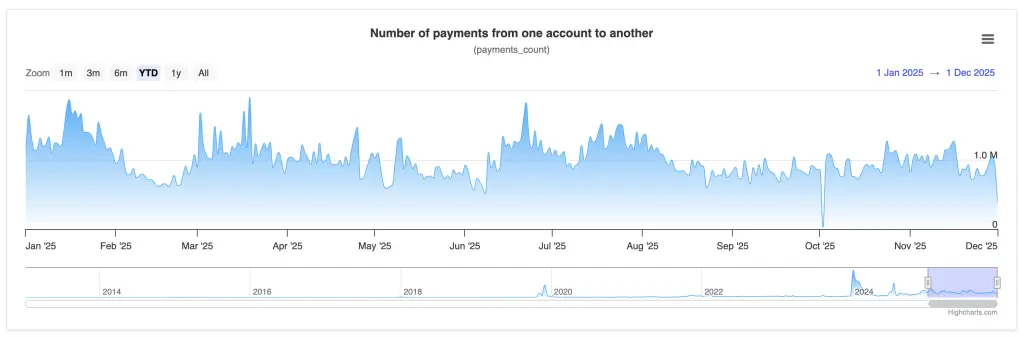
The sharp increase in on-chain activity has made XRP price predictions a focal point. Data shows that over 1.05 million payments were made between different Wallets on Saturday, an increase of 200,000 from last Wednesday, and a 15% overnight rise, indicating a significant surge in the usage of the XRP Ledger. This single-day 15% increase in payment volume is extremely rare in XRP's history, usually only occurring during major events.
Three Possible Explanations for the Surge in Payment Volume
Increased Automation: RippleNet partners enhance automated cross-border payment testing
Whale Transaction Transfer: Large holders are reallocating assets between different Wallets.
Institutional Investor Layout: After the launch of the US XRP ETF, institutions accumulated chips through OTC channels.
The first interpretation leans towards the positive. If RippleNet's partner organizations are increasing tests or formally using XRP for cross-border payments, it means that the actual application scenarios are expanding. This improvement in fundamentals should provide support for the price. However, the price is falling, and this divergence is confusing.
The second interpretation leans towards neutrality. The transfer of assets by whales between different wallets may simply be for internal management needs, such as moving assets from a hot wallet to a cold wallet for improved security, or to diversify risks among multiple custodians. This kind of operation does not necessarily indicate buying or selling, but large-scale transfers are often a precursor to significant decisions.
The third explanation is the most complex. Institutional investors typically engage in large transactions through OTC channels to avoid affecting market prices. If an XRP ETF is launched and institutions need to accumulate XRP to support ETF subscriptions, these transactions will be reflected in the increase in on-chain payment volume. However, if these transactions involve institutions selling rather than buying, then the increase in payment volume along with the price fall becomes a clear warning signal.
The trading volume nearly doubled to 4 billion USD, indicating that sellers have become more aggressive. A daily trading volume of 4 billion USD is considered extremely high for XRP, typically occurring only during periods of significant volatility or major events. This surge in trading volume combined with the price fall often suggests that a large number of holders are offloading their assets, while buying power is insufficient to support the price.
Whether this surge in payments is the beginning of a larger trend or a warning sign remains to be seen. If the payment volume continues to stay above 1 million in the following days and the price stabilizes and rebounds, it may confirm that this is a positive growth signal for applications. If the payment volume declines and the price continues to fall, it may mean that this is just a one-time anomaly.
Price fall of 6.7%: The mystery of on-chain activity and price divergence
Despite the surge in online activity, XRP has fallen by 6.7% in the past 24 hours, dropping back to $2.04 after briefly rising to higher levels last week. This divergence of increased on-chain activity but falling prices is extremely rare in XRP's history, and there are usually several explanations for it.
The first possibility is that institutions are selling large amounts on the OTC market. Institutional investors typically conduct large trades through OTC channels to avoid causing a price crash when selling on the public market. Although these trades will not immediately reflect in the exchange prices, they will increase on-chain transfer records. If institutions are reducing their holdings of XRP, they need to transfer the tokens from their cold Wallet to the OTC counterparty, which will lead to an increase in payment volume. Subsequently, OTC buyers may sell on the public market, resulting in a price fall.
The second possibility is the arbitrage operation of the XRP ETF. After the launch of the XRP ETF, market makers and arbitrageurs may engage in arbitrage transactions between the spot and ETF shares. This operation requires a large amount of on-chain transfers to adjust positions, but if the arbitrage direction is to sell the spot and buy ETF shares, it will create downward pressure on the price.
The third possibility is a technical sell-off. After a brief rebound last week, XRP failed to break through the key resistance level, and a weakening in the technical aspect triggered stop-losses and profit-taking. When a large number of stop-loss orders are triggered, it creates a chain reaction of sell-offs, with trading volume and payment volume surging, but the direction is downward rather than upward.
The trading volume nearly doubled to reach 4 billion USD, further validating the assessment of a seller-dominated market. Under normal circumstances, the daily trading volume of XRP is around 2-2.5 billion USD. A trading volume of 4 billion USD signifies a significant increase in market participation, but if this high trading volume is accompanied by a price fall, it typically indicates panic selling or large holders offloading their assets.
From the perspective of market psychology, when investors see a surge in payment volume but a decline in price, confusion and panic can arise. This confusion further undermines buying confidence, as no one is willing to enter the market under unclear circumstances. If the XRP team or major institutions can publicly explain the reasons for the surge in payment volume, it may help stabilize market sentiment.
1.90 Dollar Death Line: Falling below may crash to 1.65 Dollar
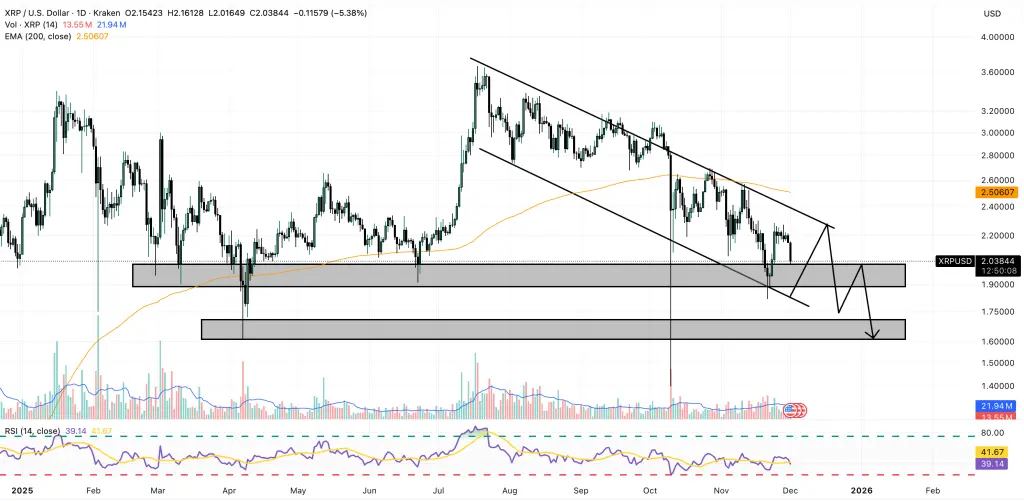
(Source: Trading View)
Despite the increased usage of the XRP Ledger, XRP price predictions appear rather pessimistic. The price seems poised to test the $1.90 region again. In late November, strong U.S. employment reports and dovish comments from the New York Federal Reserve boosted market risk sentiment, with XRP finding temporary support near $1.90.
Although this level has brought a short-term rebound, buyers have failed to follow up with sufficient momentum to trigger a full recovery. From a technical structure perspective, $1.90 is a key support level that has been tested multiple times. Over the past few weeks, each time XRP falls to this price, it has triggered a buying rebound. However, repeatedly testing the same support level often weakens its strength, as each test consumes some of the buying power.
If it falls below this key level, a larger pullback may occur, with a target price of $1.65, which means a potential drop of 19% from the current price of $2.04. A drop from the current price of $2.04 to $1.65 would be catastrophic for mainstream cryptocurrencies. More importantly, falling below $1.90 would break the current support structure and trigger a technical sell-off.
XRP Key Technical Levels and Scenario Analysis
Current Price: 2.04 USD (fall 6.7%)
Key Support: $1.90 (tested multiple times, strength weakening)
Fall below target: $1.65 (down 19%)
Bounce Target: If it holds above 1.90 USD, it may test 2.20-2.30 USD
If the support level holds, we may see the bulls re-enter the market, pushing the price to new highs in 2026. The key to holding the $1.90 level lies in whether buying power can come in significantly at this price point. If there is a rebound with increased volume, coupled with a continuous rise in payment volume and a shift in direction to positive (for example, Ripple publicly stating that it is due to application growth rather than sell-offs), it may confirm a successful bottom formation.
From the perspective of risk-reward ratio, XRP currently presents a high-risk, high-reward situation. If bought around $1.90, with a stop-loss set at $1.85 and a target price of $2.30, the risk-reward ratio is approximately 1:8. This asymmetric opportunity is attractive for risk-tolerant investors, but it also means that the probability of failure is not low.
For conservative investors, a wiser strategy is to wait for the $1.90 support to be tested and confirmed effective before entering the market. If XRP touches $1.90 multiple times in the coming days but quickly rebounds each time, and the payment volume data shows positive signals, then consideration can be given to building positions in the $1.95-$2.00 range. Conversely, if $1.90 is quickly broken on the first test, it would be prudent to wait for a lower support level at $1.65.
Is the market about to welcome a major event? Three scenario simulations
In just one night, an additional 1 million payments were made. Is the market about to welcome a major event? This is the question that the current XRP community is most concerned about. Based on historical experience, significant changes in on-chain activity are often a precursor to major events.
In an optimistic scenario, a surge in payment volume is a signal of the expansion of RippleNet applications. If a collaboration between Ripple and a large financial institution or central bank is about to be announced, prior technical testing may lead to a surge in payment volume. In this case, when the news is officially announced, the price of XRP may see a retaliatory rebound, quickly recovering lost ground and reaching new highs.
In a neutral scenario, a surge in payment volume is merely a technical factor or a one-time event. For example, a large institution adjusting its asset allocation or a batch processing by an automated system causing a short-term spike in payment volume. In such cases, the payment volume will quickly revert to normal levels, and prices will continue to operate according to the original technical indicators.
In a pessimistic scenario, a surge in payment volume is a precursor to large-scale sell-offs. Institutional investors preparing to exit their XRP positions need to consolidate tokens from various wallets to exchanges or OTC counterparties. This preparatory work will lead to a surge in payment volume. If this speculation holds, XRP may face greater selling pressure in the coming days, and the probability of falling below $1.90 and testing $1.65 will significantly increase.